CT Brain Perfusion Studies
EGEE ID. Bratislava 19/09/2007. 2. Outline. MotivationInfarct locationPerfusion and hemodynamical mapsInt.eu.grid integrationFuture Work. EGEE ID. Bratislava 19/09/2007. 3. Introduction. Collaboration between IFCA (CSIC-UC) and Hospital Universitario Marqus de Valdecilla at Santander (HUMV) rad

CT Brain Perfusion Studies
E N D
Presentation Transcript
1. CT Brain Perfusion Studies David Rodr�guez Gonz�lez
Pedro Santiago del R�o
Instituto de F�sica de Cantabria (UC-CSIC)
Enrique Marco de Lucas
Hospital Universitario Marqu�s de Valdecilla
2. EGEE ID. Bratislava 19/09/2007 2 Outline Motivation
Infarct location
Perfusion and hemodynamical maps
Int.eu.grid integration
Future Work
3. EGEE ID. Bratislava 19/09/2007 3 Introduction Collaboration between IFCA (CSIC-UC) and Hospital Universitario Marqu�s de Valdecilla at Santander (HUMV) radiologists.
Previous collaboration
Development of a tool for assisted diagnosis for brain stroke using hemodynamic parameters maps
Vendor independent parameters calculation testing several methods
Integration in int.eu.grid
4. EGEE ID. Bratislava 19/09/2007 4 Brain Stroke Brain stroke is one of the most important death and disability causes in the EU and USA.
Currently available treatments could help to reduce the extension of the problem
CT Perfusion techniques can help using the acquired images to generate brain maps showing relevant hemodynamical parameters:
MTT Mean Transition Time
BV Blood Volume
BF Blood Flow
But need accurate identification of the ischemic lession
Other relevant information for diagnosis is needed: like angiography
5. EGEE ID. Bratislava 19/09/2007 5
6. EGEE ID. Bratislava 19/09/2007 6 STROKE One million strokes occurring per year in the European Union.
NINDS trial demonstrated usefulness of thrombolytic treatment of stroke in selected patients rescuing the ischemic penumbra.
Thrombolytic treatment has an associated risk of cerebral hemorrhage up to 20%.
7. EGEE ID. Bratislava 19/09/2007 7
8. EGEE ID. Bratislava 19/09/2007 8 Core: part of the ischemic region that is irreversibly injured
Penumbra: area of the brain underperfused and in danger of infarcting.
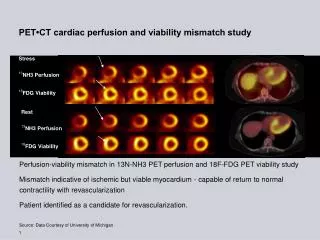
9. EGEE ID. Bratislava 19/09/2007 9 STROKE CT perfusion plays a major role by demonstrating salvageable brain tissue and extension of cerebral core infarction.
And� WHAT�S CT PERFUSION??
10. EGEE ID. Bratislava 19/09/2007 10
11. EGEE ID. Bratislava 19/09/2007 11 ANALYSIS Attenuation proportional to blood (= contrast) in brain tissue.
Time attenuation curve of reference:
-artery (ACA, MCA)
-vein
12. EGEE ID. Bratislava 19/09/2007 12 Deconvolution (MTT)
Parametric maps
CBV = AUC pixel parench/ AUC pixel artery
CBF= CBV / MTT
13. EGEE ID. Bratislava 19/09/2007 13 Vascular pathology
- Acute ischemic stroke
- Chronic ischemia
- Vasoespasm
Brain tumours
MAIN CLINICAL APPLICATIONS
14. EGEE ID. Bratislava 19/09/2007 14 �salvageable cerebral tissue??
15. EGEE ID. Bratislava 19/09/2007 15 Infarct location application Using the cerebral blood flow and the mean transit time generate a brain map showing:
The infarct core
The ischemic penumbra
Implemented in Java (ij library for the images)
Using input from GE Perfusion application
Will use also our maps when finished
The program fed with the parameter maps automatically calculates an output map
The medic can change the criteria
Also can define a good tissue region to use as reference
16. EGEE ID. Bratislava 19/09/2007 16 Infarct location Now a java standalone GUI application
It is being ported to the grid as a plugin for the Migrating Desktop
Would be linked to the parameter maps application
17. EGEE ID. Bratislava 19/09/2007 17 CT Perfusion For DCE (Dynamic Contrast Enhancement) imaging using CT (aka CT Perfusion) a sequence of images (45) at the same location are taken in a given interval.
Concertation Time Curves
The objective is to get the three parameters that are related by the central volume principle
This is done voxel by voxel
18. EGEE ID. Bratislava 19/09/2007 18 CT Perfusion Application? Input: (4*) 45 CT brain images in DICOM format
Using as reference an artery and a vein three parameters are computed for each pixel:
blood flow (CBF),
blood volume (CBV) and
mean transition time (MTT).
Prototype in Matlab
Using RegTools Toolbox by P.C. Hansen
Now implementing the algorithms in
ANSI C
Java
19. EGEE ID. Bratislava 19/09/2007 19 Deconvolution Problem
We want to obtain F and R(t)
Ctiss and Cart are the tissue and artery concentrations
R(t) is the tissue residue function and it is used to calculate the MTT
Numerical deconvolution process is very sensitive to noise in the measured data
Inherently ill-conditioned problem
20. EGEE ID. Bratislava 19/09/2007 20 Singular Value Decomposition Discretize the convolution integral equation
System of linear equations
A is a nxn matriz and x and b are vectors
Singular Value Decomposition (SVD)
21. EGEE ID. Bratislava 19/09/2007 21 Regularization Methods TSVD
Singular Value Decomposition (SVD)
Threshold or truncation index
The smaller singular values are eliminated
Limits the effects of noise
C implementation using SVDLibC
Java using JAMA
Tikhonov Regularization
Prototype in Matlab
Java using JAMA
22. EGEE ID. Bratislava 19/09/2007 22 Selection of the regularization parameter Picard plots to estimate
Currently using the L-Curve method
23. EGEE ID. Bratislava 19/09/2007 23
24. EGEE ID. Bratislava 19/09/2007 24 Project Vision Distributed Parallel (MPI) Interactive Computing and Storage at the Tera level The main features of this scientific initiative are:
- Distributed Parallel (MPI) Interactive Computing and Storage at the Tera level
User Friendly Access through a Grid Interactive Desktop with powerful visualization and real simulation steering in real time
Supporting Virtual Organizations at all levels: setup, collaborative environment, grid enhancement of applications, execution and monitoring tools.
The main features of this scientific initiative are:
- Distributed Parallel (MPI) Interactive Computing and Storage at the Tera level
User Friendly Access through a Grid Interactive Desktop with powerful visualization and real simulation steering in real time
Supporting Virtual Organizations at all levels: setup, collaborative environment, grid enhancement of applications, execution and monitoring tools.
25. EGEE ID. Bratislava 19/09/2007 25 Single sign-on / authorisation
Platform independent
Batch jobs
MPI jobs
Running interactive applications using java plugins or VNC
Monitoring grid applications
Flexible Application framework
User profile management
Easy application add on
Local and grid file management Ideally int.ue.grid will offer to the final user, a researcher, all services through an interface like the migrating desktop, integrating application, infrastructure monitoring if needed, possibility of visualization, etc.
It would be fantastic to work through this interface using transparently all the available power to profit and get answer to complex computing tasks in a short time. This would allow to share resources and at the same time attack problems that otherwise could take days.
The effort to provide a Migrating Desktop service at a production-quality level is not negligible (Marcin should/could comment). Ideally int.ue.grid will offer to the final user, a researcher, all services through an interface like the migrating desktop, integrating application, infrastructure monitoring if needed, possibility of visualization, etc.
It would be fantastic to work through this interface using transparently all the available power to profit and get answer to complex computing tasks in a short time. This would allow to share resources and at the same time attack problems that otherwise could take days.
The effort to provide a Migrating Desktop service at a production-quality level is not negligible (Marcin should/could comment).
26. EGEE ID. Bratislava 19/09/2007 26 Interactivity Users can run and steer the application from the Migrating Desktop - a graphical user interface for application management, grid and job monitoring, data and metadata management. Physical parameters and other simulation data can be changed from this graphical interface. Migrating Destop hides the details of most Grid services and allows for setting up and interactively controlling complex systems.
This is achieved by means of the Roaming Access Server , which intermediates to the communication with different grid middleware and applications.
Next the job in Job Description Language is sent to the Computing Element by the CrossBroker - the component that manages all jobs submitted by users. It supports submission of sequential and parallel jobs.
The CrossBroker chooses the most proper Computing Element, where the calculus part of this system is running in the Worker Nodes (WN) of the Grid which fit the resources requirements of the application. Once the application is deployed in those WNs, one of them is designed as Master and the others are the Slaves. The Master is in charge of the communications with all the Slaves and with the MD.
The Slaves calculate the particles trajectories, save them on the Storage Element and send them to the Master, which compiles all of them and renders the visualization.
The software link between MD and the Master WN over the network channel is Glogin (It is an interactive grid service which offers interactive bidirectional connections between a grid resource and the users desktop machine. This tool communicates both sides in both directions.
It captures user events in the MD and forwards them to the Master in one sense and, in the other sense, it outputs the graphical results from the Master in the MD with Java-based GVid video player.
It enables Java-based clients to display a videostream which is generated on a remote site and will be used within a plugin for Migrating Desktop.
As a result, the grid infrastructure is transparent to the user with very high performances.
Users can run and steer the application from the Migrating Desktop - a graphical user interface for application management, grid and job monitoring, data and metadata management. Physical parameters and other simulation data can be changed from this graphical interface. Migrating Destop hides the details of most Grid services and allows for setting up and interactively controlling complex systems.
This is achieved by means of the Roaming Access Server , which intermediates to the communication with different grid middleware and applications.
Next the job in Job Description Language is sent to the Computing Element by the CrossBroker - the component that manages all jobs submitted by users. It supports submission of sequential and parallel jobs.
The CrossBroker chooses the most proper Computing Element, where the calculus part of this system is running in the Worker Nodes (WN) of the Grid which fit the resources requirements of the application. Once the application is deployed in those WNs, one of them is designed as Master and the others are the Slaves. The Master is in charge of the communications with all the Slaves and with the MD.
The Slaves calculate the particles trajectories, save them on the Storage Element and send them to the Master, which compiles all of them and renders the visualization.
The software link between MD and the Master WN over the network channel is Glogin (It is an interactive grid service which offers interactive bidirectional connections between a grid resource and the users desktop machine. This tool communicates both sides in both directions.
It captures user events in the MD and forwards them to the Master in one sense and, in the other sense, it outputs the graphical results from the Master in the MD with Java-based GVid video player.
It enables Java-based clients to display a videostream which is generated on a remote site and will be used within a plugin for Migrating Desktop.
As a result, the grid infrastructure is transparent to the user with very high performances.
27. EGEE ID. Bratislava 19/09/2007 27 Integration in int.eu.grid The TSVD is already running in int.eu.grid
Working on Tikhonov regularization
The infarct location Java application would be included in a MD visualization plugin that:
Use DICOM images already at int.eu.grid SEs or register new ones (with anonymization)
Would run the brain parameters map creation application using TSVD or Tikhonov
Using them would create the core and penumbra map.
28. EGEE ID. Bratislava 19/09/2007 28 Other Future Work Implementing alternative techniques for getting the perfusion and hemodynamic parameters:
Frequencies filtering
Parametrical approaches
Bayesian
Comparing all these techniques with simulated and real data
Using Monte Carlo simulations to check the methods robustness against different levels of SNR
Adapting the application for other medical uses of CT perfusion:
Brain tumors