Download
1 / 33
330 likes | 436 Views
This document explores the electrical properties of static combinational gates, focusing on their transfer characteristics, delay, and power consumption. It discusses the effects of parasitics on gate performance, driving large loads, and the importance of logic levels defined by VSS and VDD. The document explains logic level matching, noise margins, and the methods for measuring gate delay, including the use of RC models. Additionally, it covers power consumption aspects, including static power dissipation and the influence of parasitics on circuit performance, providing insights into optimizing logic families.

E N D
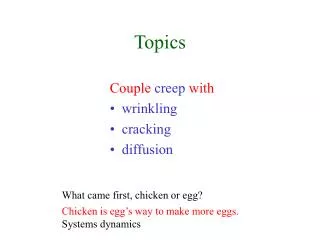
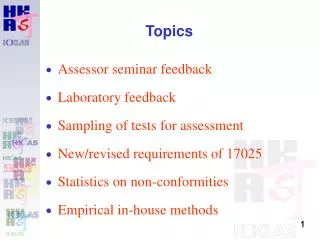
Topics • Electrical properties of static combinational gates: • transfer characteristics; • delay; • power. • Effects of parasitics on gate. • Driving large loads.
Logic levels • Solid logic 0/1 defined by VSS/VDD. • Inner bounds of logic values VL/VH are not directly determined by circuit properties, as in some other logic families. VDD logic 1 VH unknown VL logic 0 VSS
Logic level matching • Levels at output of one gate must be sufficient to drive next gate.
Transfer characteristics • Transfer curve shows static input/output relationship—hold input voltage, measure output voltage.
Logic thresholds • Choose threshold voltages at points where slope of transfer curve = -1. • Inverter has a high gain between VIL and VIH points, low gain at outer regions of transfer curve. • Note that logic 0 and 1 regions are not equal sized—in this case, high pullup resistance leads to smaller logic 1 range.
Noise margin • Noise margin = voltage difference between output of one gate and input of next. Noise must exceed noise margin to make second gate produce wrong output. • In static gates, t= voltages are VDD and VSS, so noise margins are VDD-VIH and VIL-VSS.
Delay • Assume ideal input (step), RC load.
Delay assumptions • Assume that only one transistor is on at a time. This gives two cases: • rise time, pullup on; • fall time, pullup off. • Assume resistor model for transistor. Ignores saturation region and mischaracterizes linear region, but results are acceptable.
Current through transistor • Transistor starts in saturation region, then moves to linear region.
Capacitive load • Most capacitance comes from the next gate. • Load is measured or analyzed by Spice. • Cl: load presented by one minimum-size transistor. CL = S (W/L)i Cl
Resistive model for transistor • Average V/I at two voltages: • maximum output voltage • middle of linear region • Voltage is Vds, current is given Id at that drain voltage. Step input means that Vgs = VDD always.
Ways of measuring gate delay • Delay: time required for gate’s output to reach 50% of final value. • Transition time: time required for gate’s output to reach 10% (logic 0) or 90% (logic 1) of final value.
Inverter delay circuit • Load is resistor + capacitor, driver is resistor.
Inverter delay with t model • t model: gate delay based on RC time constant t. • Vout(t) = VDD exp{-t/(Rn+RL)/ CL} • tf = 2.2 R CL • For pullup time, use pullup resistance.
t model inverter delay • 0.5 micron process: • Rn = 6.47 kW • Cl = 0.89 fF • CL = 1.78 fF • So • td = 0.69 x 6.47E3 x 1.78E-15 = 7.8 ps. • tf = 2.2 x 6.47E3 x 1.78E-15 = 26.4 ps.
Power consumption analysis • Almost all power consumption comes from switching behavior. • Static power dissipation comes from leakage currents. • Surprising result: power consumption is independent of the sizes of the pullups and pulldowns.
Other models • Current source model (used in power/delay studies): • tf = CL (VDD-VSS)/Id • = CL (VDD-VSS)/0.5 k’ (W/L) (VDD-VSS -Vt)2 • Fitted model: fit curve to measured circuit characteristics.
Body effect and gates • Difference between source and substrate voltages causes body effect. • Source for gates in middle of network may not equal substrate: 0 Source above VSS 0
Body effect and gate input ordering • To minimize body effect, put early arriving signals at transistors closest to power supply: Early arriving signal
Power consumption circuit • Input is square wave.
Power consumption • A single cycle requires one charge and one discharge of capacitor: E = CL(VDD - VSS)2 . • Clock frequency f = 1/t. • Energy E = CL(VDD - VSS)2. • Power = E x f = f CL(VDD - VSS)2.
Observations on power consumption • Resistance of pullup/pulldown drops out of energy calculation. • Power consumption depends on operating frequency. • Slower-running circuits use less power (but not less energy to perform the same computation).
Speed-power product • Also known as power-delay product. • Helps measure quality of a logic family. • For static CMOS: • SP = P/f = CV2. • Static CMOS speed-power product is independent of operating frequency. • Voltage scaling depends on this fact.
Effect of parasitics • a: Capacitance on power supply is not bad, can be good in absence of inductance. Resistance slows down static gates, may cause pseudo-nMOS circuits to fail.
Effects of parasitics, cont’d • b: Increasing capacitance/resistance reduces input slope. • c: Similar to parasitics at b, but resistance near source is more damaging, since it must charge more capacitance.
Driving large loads • Sometimes, large loads must be driven: • off-chip; • long wires on-chip. • Sizing up the driver transistors only pushes back the problem—driver now presents larger capacitance to earlier stage.
Optimal sizing • Use a chain of inverters, each stage has transistors a larger than previous stage. • Minimize total delay through driver chain: • ttot = n(Cbig/Cg)1/n tmin. • Optimal number of stages: • nopt = ln(Cbig/Cg). • Driver sizes are exponentially tapered with size ratio a.