Download
1 / 11
180 likes | 650 Views
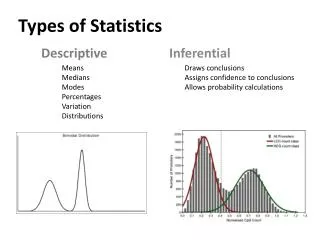
Means Medians Modes Percentages Variation Distributions. Draws conclusions Assigns confidence to conclusions Allows probability calculations. Types of Statistics. Descriptive Inferential.

E N D
Means Medians Modes Percentages Variation Distributions Draws conclusions Assigns confidence to conclusions Allows probability calculations Types of Statistics Descriptive Inferential
FIGURE 5. Student performance in (A) midsemester and (B) final exams across 2010 (n = 265) and 2011 (n = 264) offerings of MICR2000. Wang, Schembriand Hall JMBE 14:12-24 (2013)
FIGURE 6. Student Evaluation of Course and Teaching (SECaT) scores across 2010 and 2011 offerings of MICR2000. Students were invited to voluntarily respond to surveys regarding their evaluation of teaching within MICR2000 in 2010 (n = 108) and 2011 (n = 87) using a standardized University-Wide Student Evaluation of Course and Teaching (SECaT) survey instrument. Student responses corresponded to a 5 -point Likert scale and quantified as follows: 1 = Strongly Disagree; 2 = Disagree; 3 = Neutral; 4 = Agree; 5 = Strongly Agree. Bars represent mean +/– standard error of the mean (SEM). *Denotes a statistically significant difference between student responses for 2010 and 2011 offerings of MICR2000, as determined by the Mann-Whitney U test (p < 0.05). Wang, Schembriand Hall JMBE 14:12-24 (2013)
Three Kinds of Data Nominal Ordinal Interval Categorical No mean ex: ● Marriage status ● Gender Sounds like “NAME” Natural ordering Unequal intervals ex: ● Rankings ● Survey data Sounds like “ORDER” Extends ordinal data Equal intervals ex: ● Temperature ● Time Sounds like what it is
HurneyJMBE 13:133-141 (2012) Boone and Boone Journal of Extension 50:2TOT2 (April 2012)
Problem (Theory) Question (Hypothesis) Methods (treatment, control groups) Intervention Data (Triangulation) Conclusions Change practice
Frequency, %, Goodness-of-fit, One category Nominal or Ordinal (Qualitative) Frequency, %, Contingency table, Test of Association, Two categories Degree of Relationship Pearson Correlation Primary Interest Continuous Form of Relationship Linear Regression One Measurement Type of Data Spearman’s rS Ranks Number of Predictors Relationships Multiple Regression Multiple Independent samples t Independent Interval (Quantitative) Type of Question Mann-Whitney U Relation Between Groups Two Paired Samples t Dependent Wilcoxon One-Way ANOVA Number of Groups Differences One Kruskal-Wallis Number of Indep. Var. Independent Multiple Relation Between Groups Factorial ANOVA Multiple Repeated Measures ANOVA Dependent Adapted from D.C. Howell, Fundamental Statistics for the Behavioral Sciences (6th ed.) Wadsworth Cengage Learning (2008) Friedman
Collect student demographic data • Want to discover if students between treatment and control groups had the similar ethnic backgrounds • Collect test grades before and after intervention • Want to see if your teaching intervention resulted in a significant difference in test scores between control and treated groups • Survey students on their own perceptions of learning • Want to see if your teaching intervention resulted in a significant increase among responses to Likert-scale questions regarding student learning gains between control and treated groups
Graduate school level: You have categorized your students into three performance groups; novice, developing, and expert based on high school GPA and SAT data. You want to compare the performance of these groups on a critical thinking assessment before and after your teaching intervention.