Download
1 / 1
10 likes | 167 Views
Regional admittivity spectra with Tomosynthesis images f or breast cancer detection Tzu-Jen. Kao 1 , G. Boverman 1 , J.C. Newell 1 , D. Isaacson 2 , G.J. Saulnier 3 , R.H. Moore 4 and D.B. Kopans 4

E N D
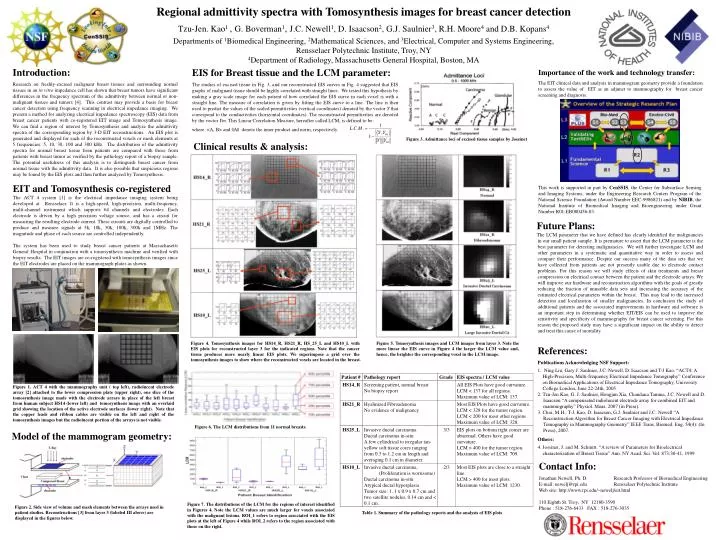
Regional admittivityspectra with Tomosynthesis images for breast cancer detection Tzu-Jen. Kao1 , G. Boverman1, J.C. Newell1, D. Isaacson2, G.J. Saulnier3, R.H. Moore4 and D.B. Kopans4 Departments of 1Biomedical Engineering, 2Mathematical Sciences, and 3Electrical, Computer and Systems Engineering,Rensselaer Polytechnic Institute, Troy, NY 4Department of Radiology, Massachusetts General Hospital, Boston, MA Introduction: Researchon freshly-excised malignant breast tissues and surrounding normal tissues in an in vitro impedance cell has shown that breast tumors have significant differences in the frequency spectrum of the admittivity between normal or non-malignant tissues and tumors [4]. This contrast may provide a basis for breast cancer detection using frequency scanning in electrical impedance imaging.We present a method for analyzing electrical impedance spectroscopy (EIS) data from breast cancer patients with co-registered EIT image and Tomosynthesis image. We can find a region of interest by Tomosynthesis and analyze the admittivity spectra of the corresponding region by 3-D EIT reconstructions. An EIS plot is generated and displayed for each of the reconstructed voxels or mesh elements at 5 frequencies: 5, 10, 30, 100 and 300 kHz. The distribution of the admittivity spectra for normal breast tissue from patients arecompared with those from patients with breast tumor as verified by the pathology report of a biopsy sample. The potential usefulness of this analysis is to distinguish breast cancer from normal tissue with theadmittivity data. It is also possible that suspicious regions may be found by the EIS plots and then further analyzed by Tomosynthesis. EIS for Breast tissue and the LCM parameter: The studies of excised tissue in Fig. 3, and our reconstructed EIS curves in Fig. 4 suggested that EIS graphs of malignant tissue should be highly correlated with straight lines. We tested this hypothesis by making a gray scale image for each patient of how correlated the EIS curve in each voxel is with a straight line. The measure of correlation is given by fitting the EIS curve to a line. The line is then used to predict the values of the scaled permittivities (vertical coordinates) denoted by the vector Y that correspond to the conductivities (horizontal coordinates). The reconstructed permittivities are denoted by the vector Ym. This Linear Correlation Measure, hereafter called LCM, is defined to be: where <A, B> and ||A|| denote the inner product and norm, respectively. Importance of the work and technology transfer: The EIT clinical data and analysis in mammogram geometry provide a foundation to assess the value of EIT as an adjunct to mammography for breast cancer screening and diagnosis. Figure 3.Admittance loci of excised tissue samples by Jossinet Clinical results & analysis: EIT and Tomosynthesis co-registered The ACT 4 system [1] is the electrical impedance imaging system being developed at Rensselaer. It is a high-speed, high-precision, multi-frequency, multi-channel instrument which supports 64 channels and electrodes. Each electrode is driven by a high precision voltage source, and has a circuit for measuring the resulting electrode current. These circuits are digitally controlled to produce and measure signals at 5k, 10k, 30k, 100k, 300k and 1MHz. The magnitude and phase of each source are controlled independently. The system has been used to study breast cancer patients at Massachusetts General Hospital in conjunction with a tomosynthesis machine and verified with biopsy results. The EIT images are co-registered with tomosynthesis images since the EIT electrodes are placed on the mammograph plates as shown. This work is supported in part by CenSSIS, the Center for Subsurface Sensing and Imaging Systems, under the Engineering Research Centers Program of the National Science Foundation (Award Number EEC-9986821) and by NIBIB, the National Institute of Biomedical Imaging and Bioengineering under Grant Number R01-EB000456-03. Future Plans: The LCM parameter that we have defined has clearly identified the malignancies in our small patient sample. It is premature to assert that the LCM parameter is the best parameter for detecting malignancies. We will further investigate LCM and other parameters in a systematic and quantitative way in order to assess and compare their performance.Despite our success many of the data sets that we have collected from patients are not presently usable due to electrode contact problems. For this reason we will study effects of skin treatments and breast compression on electrical contact between the patient and the electrode arrays.We will improve our hardware and reconstruction algorithms with the goals of greatly reducing the fraction of unusable data sets and increasing the accuracy of the estimated electrical parameters within the breast. This may lead to the increased detection and localization of smaller malignancies. In conclusion the study of additional patients and the associated improvements in hardware and software is an important step in determining whether EIT/EIS can be used to improve the sensitivity and specificity of mammography for breast cancer screening. For this reason the proposed study may have a significant impact on the ability to detect and treat this cause of mortality. Figure 4. Tomosynthesis images for HS14_R, HS21_R, HS_25_L and HS10_L with EIS plots for reconstructed layer 3 for the indicated regions. Note that the cancer tissue produces more nearly linear EIS plots. We superimpose a grid over the tomosynthesis images to show where the reconstructed voxels are located in the breast. Figure 5. Tomosynthesis images and LCM images from layer 3. Note the more linear the EIS curve in Figure 4 the larger the LCM value and, hence, the brighter the corresponding voxel in the LCM image. References: Publications Acknowledging NSF Support: 1. Ning Liu, Gary J. Saulnier, J.C. Newell, D. Isaacson and T-J Kao. “ACT4: A High-Precision, Multi-frequency Electrical Impedance Tomography” Conference on Biomedical Applications of Electrical Impedance Tomography, University College London, June 22-24th, 2005. 2. Tzu-Jen Kao, G. J. Saulnier, Hongjun Xia, Chandana Tamma, J.C. Newell and D. Isaacson “A compensated radiolucent electrode array for combined EIT and mammography” Physiol. Meas. 2007 (in Press). 3. Choi, M.H., T-J. Kao, D. Isaacson, G.J. Saulnier and J.C. Newell “A Reconstruction Algorithm for Breast Cancer Imaging with Electrical Impedance Tomography in Mammography Geometry” IEEE Trans. Biomed. Eng. 54(4): (In Press), 2007. Others: 4. Jossinet, J. and M. Schmitt. “A review of Parameters for Bioelectrical characterization of Breast Tissue” Ann. NY Acad. Sci. Vol. 873:30-41, 1999 Figure 1. ACT 4 with the mammography unit ( top left), radiolucent electrode array [2] attached to the lower compression plate (upper right), one slice of the tomosynthesis image made with the electrode arrays in place of the left breast from human subject HS14 (lower left) and tomosynthesis image with an overlaid grid showing the location of the active electrode surfaces (lower right). Note that the copper leads and ribbon cables are visible on the left and right of the tomosynthesis images but the radiolucent portion of the arrays is not visible. Figure 6. The LCM distributions from 11 normal breasts. Model of the mammogram geometry: Contact Info: Jonathan Newell, Ph. D. Research Professor of Biomedical Engineering E-mail: newelj@rpi.edu Rensselaer Polytechnic Institute Web site: http://www.rpi.edu/~newelj/eit.html 110 Eighth St. Troy, NY 12180-3590 Phone : 518-276-6433 FAX : 518-276-3035 Figure 7. The distributions of the LCM for the regions of interest identified in Figures 4. Note the LCM values are much larger for voxels associated with the malignant lesions. ROI_1 refers to region associated with the EIS plots at the left of Figure 4 while ROI_2 refers to the region associated with those on the right. Figure 2. Side view of volume and mesh elements between the arrays used in patient studies. Reconstructions [3] from layer 3 (labeled III above) are displayed in the figures below. Table 1. Summary of the pathology reports and the analysis of EIS plots