Download
1 / 42
430 likes | 592 Views
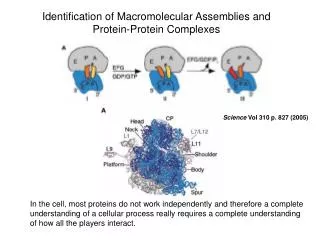
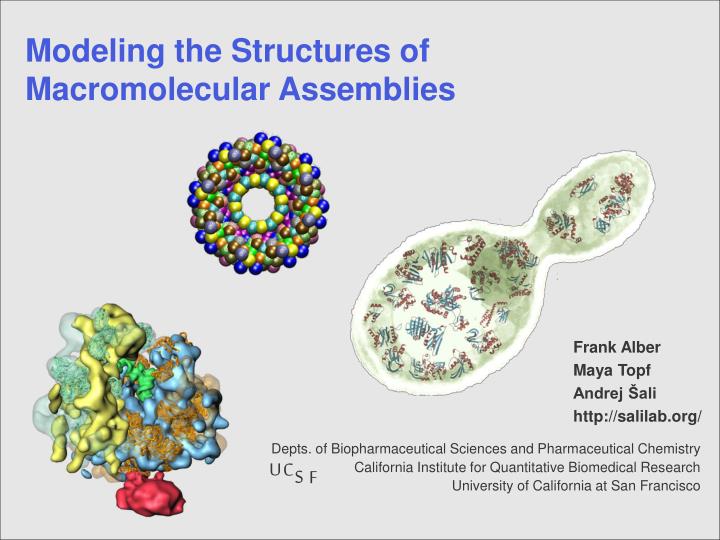
U. C. S. F. Modeling the Structures of Macromolecular Assemblies. Depts. of Biopharmaceutical Sciences and Pharmaceutical Chemistry California Institute for Quantitative Biomedical Research University of California at San Francisco. Frank Alber Maya Topf Andrej Šali http://salilab.org/.

E N D
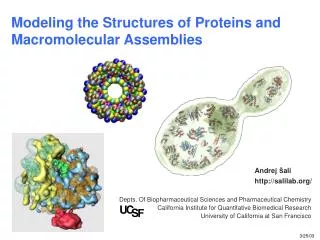
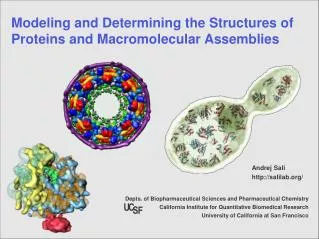
U C S F Modeling the Structures of Macromolecular Assemblies Depts. of Biopharmaceutical Sciences and Pharmaceutical Chemistry California Institute for Quantitative Biomedical Research University of California at San Francisco Frank Alber Maya Topf Andrej Šali http://salilab.org/
Contents • Modeling of assemblies by optimization (5’, Andrej) • Representation for modeling, illustrated by NPC (15’, Frank) • Comparative modeling (10’, Andrej) • Combined comparative modeling and density fitting (10’, Maya)
Acknowledgments http://salilab.org Our group/assemblies Frank Alber Maya Topf Fred Davis Dmitry Korkin M.S. Madhusudhan Damien Devos Marc A. Martí-Renom Mike Kim Bino John Narayanan Eswar Ursula Pieper Min-yi Shen E. coli ribosome H.Gao J.Sengupta M.Valle A.Korostelev S.Stagg P.Van Roey R.Agrawal S.Harvey M.Chapman J.Frank EM Wah Chiu Matt Baker Wen Jiang Chandrajit Bajaj Yeast NPC Tari Suprapto Julia Kipper Wenzhu Zhang Liesbeth Veenhoff Sveta Dokudovskaya Mike Rout Brian Chait NIH NSF Sinsheimer Foundation A. P. Sloan Foundation Burroughs-Wellcome Fund Merck Genome Res. Inst. Mathers Foundation I.T. Hirschl Foundation The Sandler Family Foundation SUN IBM Intel Structural Genomix Structural Genomics Stephen Burley (SGX) John Kuriyan (UCB) NY-SGRC
Protein and assembly structure by experiment and computation Sali, Earnest, Glaeser, Baumeister. From words to literature in structural proteomics. Nature 422, 216-225, 2003.
Determining the structures of proteins and assemblies Use structural information from any • source: measurement, first principles, rules, • resolution: low or high resolution to obtain the set of all models that are consistent with it.
Modeling proteins and macromolecular assemblies by satisfaction of spatial restraints • Representation of a system. • Scoring function (spatial restraints). • Optimization. There is nothing but points and restraints on them. Sali, Earnest, Glaeser, Baumeister. Nature 422, 216-225, 2003.
Assembly representation for modeling(visualization) • Multi-scale representation: Resolution of subunit structures can vary largely. • Hierarchical representation: Spatial information about subunit-subunit interactions may be available at different resolutions. • Flexibility of subunits: Subunit structures may be subject to conformational changes upon assembly formation. • Points and restraints between them (distance, angle dihedral restraints).
Software implementation • Assembler, extension of MODELLER • Provides a framework for assembly modelling: • multi-scale hierarchical representations, • integration of experimental input data, • calculates models that are consistent with input data.
Cross-linking Cross-linking Cross-linking Cryo-EM/ tomography Cross-linking FRET FRET FRET FRET Site-directed mutagenesis Site-directed mutagenesis Site-directed mutagenesis Site-directed mutagenesis Computational docking Computational docking Computational docking Computational docking Binding site predictions Binding site predictions Binding site predictions Binding site predictions Correlated mutations Cryo-EM/ tomography Cryo-EM/ tomography Cryo-EM/ tomography Tandem affinity purification Tandem affinity purification Immuno-EM Yeast-two-hybrid Resolution of restraints 300Å 1Å Cross-linking FRET Site-directed mutagenesis Computational docking Binding site predictions Correlated mutations
Resolution of restraints 300Å 1Å Cross-linking Cross-linking Cross-linking Cross-linking Cryo-EM/ tomography Cross-linking FRET FRET FRET FRET FRET Site-directed mutagenesis Site-directed mutagenesis Site-directed mutagenesis Site-directed mutagenesis Site-directed mutagenesis Computational docking Cryo-EM/ tomography Cryo-EM/ tomography Computational docking Computational docking Binding site predictions Binding site predictions Binding site predictions Cryo-EM/ tomography Cryo-EM/ tomography Cryo-EM/ tomography Tandem affinity purification Tandem affinity purification Immuno-EM Yeast-two-hybrid
Binding patches Properties of points Interaction centers: Define interaction centers at each structural level. Interaction centers transmit interactions between assembly subunits.
Subunit flexibility: q q Allow or restrict conformational degrees of freedom within assembly subunits. Properties of points Interaction centers: Define interaction centers at each structural level. Interaction centers transmit interactions between assembly subunits. Design alternative internal restraints sets for different conformational states.
Modeling the Yeast Nuclear Pore complex by satisfaction of spatial restraints Andrej Sali Frank Alber, Damien Devos Mike Rout, T. Suprapto, J. Kipper, L. Veenhoff, S. Dokudovskaya Brian Chait, W. Zhang Depts. Of Biopharmaceutical Sciences and Pharmaceutical Chemistry California Institute for Quantitative Biomedical Research University of California at San Francisco The Rockefeller University, 1230 York Avenue, New York http://salilab.org/
Integrate spatial information NUP Stoichiometry NUP Localization NUP- NUP Interactions Symmetry Global shape NUP Shape 2) 3) 1)
Analysis of models • Assessing the well scoring models: • How similar are the models to each other? • Do the models make sense given other data? • Search for conservation of : • Protein-protein contacts • Structural features • Visualization of the results: • Probability distribution of subunit positions (density maps)
TEMPLATE Template Search Target – Template Alignment ASILPKRLFGNCEQTSDEGLKIERTPLVPHISAQNVCLKIDDVPERLIPE MSVIPKRLYGNCEQTSEEAIRIEDSPIV---TADLVCLKIDEIPERLVGE Model Building Model Evaluation No OK? Yes END Steps in Comparative Protein Structure Modeling START TARGET ASILPKRLFGNCEQTSDEGLKIERTPLVPHISAQNVCLKIDDVPERLIPERASFQWMNDK A. Šali, Curr. Opin. Biotech. 6, 437, 1995. R. Sánchez & A. Šali, Curr. Opin. Str. Biol. 7, 206, 1997. M. Marti et al. Ann. Rev. Biophys. Biomolec. Struct., 29, 291, 2000. http://salilab.org/
3D GKITFYERGFQGHCYESDC-NLQP… SEQ GKITFYERG---RCYESDCPNLQP… F(R) = Ppi (fi /I) 1. Extract spatial restraints i 2. Satisfy spatial restraints Comparative modeling by satisfaction of spatial restraints MODELLER A. Šali & T. Blundell. J. Mol. Biol. 234, 779, 1993. J.P. Overington & A. Šali. Prot. Sci. 3, 1582, 1994. A. Fiser, R. Do & A. Šali, Prot. Sci., 9, 1753, 2000. http://salilab.org/
70% of models based on <30% sequence identity to template. On average, only a domain per protein is modeled (an “average” protein has 2.5 domains of 175 aa). Comparative modeling of the TrEMBL database Unique sequences processed: 1,182,126 Sequences with fold assignments or models: 659,495(56%) 9/15/03 ~4 weeks on 660 Pentium CPUs
http://salilab.org/modbase Pieper et al., Nucl. Acids Res. 2002.
Characterize most proteinsequencesbased on related knownstructures. The number of “families” is much smaller than the number of proteins. Any one of the members of a family is fine. Structural Genomics Sali. Nat. Struct. Biol. 5, 1029, 1998. Sali et al. Nat. Struct. Biol., 7, 986, 2000. Sali. Nat. Struct. Biol.7, 484, 2001. Baker & Sali. Science 294, 93, 2001. Characterize most protein sequences based on related known structures. There are~16,00030% seq id families (90%) (Vitkup et al. Nat. Struct. Biol. 8, 559, 2001).
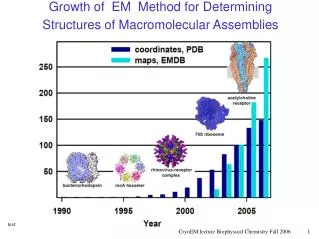
E. coli ribosome H.Gao, J.Sengupta, M.Valle, A. Korostelev, N.Eswar, S.Stagg, P.Van Roey, R.Agrawal, S.Harvey, A.Sali, M.Chapman, and J.Frank. Cell113, 789-801, 2003. • Cryo-EM density map of the 70S ribosome of E. coli was determined at ~12Å. • Calculate comparative models of the proteins and rRNA based on T. thermophilus, H. marismortui, and D. radiodurans ribosome structures. • For each protein, select the best model among several alternatives based on model assessment by statistical potentials, model compactness, target-template sequence identity, quality of template structure, and fit into the EM map. • Obtain an assembly model by multi-rigid body real-space refinement of the fit into the EM map, by RSRef (M. Chapman). • Repeat 3 and 4 iteratively to get an optimized model.
E. coli ribosome Fitting of comparative models into 12Å cryo-electron density map. All 29 proteins in 30S and 29 of 36 proteins in the 50S subunit could be modeled on 22-73% seq.id. to a known structure. The models generally cover whole folds, but tails. H.Gao, J.Sengupta, M.Valle, A. Korostelev, N.Eswar, S.Stagg, P.Van Roey, R.Agrawal, S.Harvey, A.Sali, M.Chapman, and J.Frank. Cell113, 789-801, 2003.
Errors in comparative models vs. resolution Incorrecttemplate Rigid body movement Misalignment Region without a template Distortion/shifts in aligned regions Sidechain packing 2Å 20Å 10Å Maps courtesy of Wah Chiu.
alignment alignment Comparative modeling 105 model building model building 104 Moulding Models per alignment model assessment model assessment Threading 1 1 104 1030 Alignments Moulding: iterative alignment, model building, model assessment B. John, A. Sali. Nucl. Acids Res. 31, 3982, 2003.
alignment alignment model building model assessment Moulding
final Ca RMSD 3.6Å Application to a difficult modeling case1BOV-1LTS (4.4% sequence identity) initial Ca RMSD 10.1Å 1lts structure 1lts model
Given a sequence-structure pair and an EM map: Exploring alignment (CM) and rigid body (EM) degrees of freedom 1. Generate a set of comparative models by a standard procedure. 2. Select the model that fits the EM map best. More generally: Use the quality of the best fit into the EM map as one of the model fitness criteria in MOULDER. With Wah Chiu et al.
Moulding protocol alignment model building model assessment S fold assignment helixhunter, sheehunter PROF, PSIPRED Initial alignment alignment MODELLER model building MODELLER foldhunter, EM docking algorithm model fitting GA341 score PROSA score EM fitting score model assessment E
Application: Rice Dwarf Virus (6.8Å EM) • Fold assignment: HELIXHUNTER and DEJAVU - 2 templates: • Upper domain (beta sheet) - bluetongue virus VP7 (1bvp) • Lower domain (helical) - rotavirus VP6 (1qhd) • Generate initial alignments : HELIXHUNTER and secondary structure prediction methods • MOULDING: • Iterative alignment - restrained by EM data • Model building with MODELLER, loop optimization • Model assessment (GA341 score and PROSA score) • Model fitting (FOLDHUNTER) With Wah Chiu et al.
Upper domain - good fit loop optimization: EM-derived restraints + MM forcefield
Lower domain - to improve fit MODELLER-derived restraints model fitting EM-derived restraints best fitted structure
Acknowledgments http://salilab.org Structural Genomics Stephen Burley (SGX) John Kuriyan (UCB) NY-SGRC Ribosomes H.Gao J.Sengupta M.Valle A.Korostelev S.Stagg P.Van Roey R.Agrawal S.Harvey M.Chapman J.Frank Comparative Modeling Bino John Narayanan Eswar Ursula Pieper Marc A. Martí-Renom NIH NSF Sinsheimer Foundation A. P. Sloan Foundation Burroughs-Wellcome Fund Merck Genome Res. Inst. Mathers Foundation I.T. Hirschl Foundation The Sandler Family Foundation SUN IBM Intel Structural Genomix LSD Patsy Babbitt, Fred Cohen, Ken Dill, Tom Ferrin, John Irwin, Matt Jacobson, Tanja Kortemme, Tack Kuntz, Brian Shoichet, Chris Voigt
Score Analysis • Assessing the well scoring models • How similar are the models to each other? • Do the models make sense given other data? • Using “toy” models as benchmarks.
NUP type frequency NUP type Analysis • Search conservation of : • Protein-protein contacts • Structural features
E. coli ribosome H.Gao, J.Sengupta, M.Valle, A. Korostelev, N.Eswar, S.Stagg, P.Van Roey, R.Agrawal, S.Harvey, A.Sali, M.Chapman, and J.Frank. Cell113, 789-801, 2003. • … • Calculate comparative models of the proteins and rRNA based on T. thermophilus, H. marismortui, and D. radiodurans ribosome structures. • For each protein, select the best model among several alternatives based on model assessment by statistical potentials, model compactness, target-template sequence identity, quality of template structure, and fit into the EM map. • Obtain the final assembly model by rigid body real-space refinement of the fit into the EM map, by RSRef (M. Chapman). • Repeat 3 and 4.
Combining Modeller and Docking of Atomic Models into EM Density Maps (ModEM?)
Improving resolution and accuracy of molecular models determined by cryo-EM and comparative protein structure prediction Map courtesy of Wah Chiu.
Incorrecttemplate Misalignment Distortion/shifts in aligned regions MODEL X-RAY TEMPLATE Region without a template Sidechain packing Typical errors in comparative models Marti-Renom et al. Annu.Rev.Biophys.Biomol.Struct. 29, 291-325, 2000.