

Abstract
E N D
Presentation Transcript
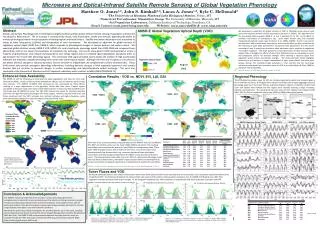
Conclusion & Acknowledgements The AMSR-E microwave VOD time series provides a unique phenology signal that is complementary to optical-IR remote sensing derived VI products, and shows promise for global monitoring of phenology related events, bioclimatic indicators and ecosystem fluxes. We are working to combine these data to produce improved phenology measures optimized for a broad range of global, atmospheric and environmental conditions. We thank the tower site principal investigators for providing data for use in this study, including Dennis Baldocchi (Vaira Ranch, Tonzi Ranch), Danilo Dragoni (Morgan Monroe), Mike Goulden(UCI 1850 Burn Site). The AMSR-E VOD and associated biophysical retrievals from this study are available through the UMT online data archives (ftp://ftp.ntsg.umt.edu/data) and the NSIDC (http://nsidc.org/data/nsidc-0451.html). Microwave and Optical-Infrared Satellite Remote Sensing of Global Vegetation Phenology Matthew O. Jones1,2, John S. Kimball1,2, Lucas A. Jones1,2, Kyle C. McDonald31The University of Montana Flathead Lake Biological Station, Polson, MT2Numerical Terradynamic Simulation Group, The University of Montana, Missoula, MT3Jet Propulsion Laboratory, California Institue of Technology, Pasadena, CAEmail Contact: matt.jones@ntsg.umt.edu Websites: www.umt.edu/flbs & www.ntsg.umt.edu Abstract AMSR-E Global Vegetation Optical Depth (VOD) We developed an algorithm for global retrieval of VOD at 10.65GHz across diverse land covers that requires minimal ancillary information (Jones et al. 2009a). The algorithm uses the descending (AM) overpass AMSR-E H and V polarized Tb at 18.7 and 23.8GHz to estimate near-surface air temperature (Ts), open water fraction (fw), and vertically integrated atmospheric water vapor (V) (Jones at al., 2009a; 2009b). Ts and V are used to calculate the V and H polarization emissivity for each channel which are then normalized by the emissivity of open water (considered a constant) at each polarization. The ratio of the normalized H and V emissivities provides a slope parameter that is sensitive to vegetation and surface roughness. The slope parameter is smoothed with a 30-day moving window median filter to mitigate the effects of short term fluctuations due to precipitation events and subsequent surface soil moisture changes, while retaining a seasonal signal from vegetation water content and biomass changes. The slope parameter shows negligible sensitivity to soil moisture, is largely independent of open water effects and varies with canopy density. The smoothed slope parameter is then inserted into the tau-omega radiative transfer model and inverted to solve for VOD, then scaled (Njoku & Chan, 2006) to represent VOD at 10.65GHz. Njoku, E. G., and S. K. Chan (2006), Remote Sensing Of Environment, 100, 190-199. Global Land Surface Phenology (LSP) monitoring has largely involved satellite optical-infrared remote sensing of vegetation indices (VIs) including EVI, NDVI and LAI. The VI accuracy is constrained by clouds, solar illumination, smoke and aerosols, degrading the ability to monitor phenological events in key ecosystems including tropical and boreal forests. Satellite microwave observations are insensitive to clouds at lower frequencies (≤10GHz) and independent of solar illumination. We developed an algorithm for global retrieval of vegetation optical depth (VOD) from AMSR-E, which responds to phenological changes in canopy biomass and water content. We examined global relations among AMSR-E VOD, MODIS VIs, and a bioclimatic phenology model from 2003-2008 and compared these observations with in situ tower measurements of ecosystem CO2 exchange. Our results show good VI-VOD correspondence across a majority of global biomes and reduced correspondence over cloudy regions due to VI related signal degradation and phase-shifts or lags between the VI and VOD phenology signals. The microwave VOD signal provided nearly double the number of high quality (QC) retrievals and relatively complete phenology time series over some tropical regions. Although the VOD and VI signals co-vary they do not detect identical changes in seasonal dynamics and are sensitive to independent yet complimentary surface characteristics. These multi-sensor data provide synergistic phenology information, including dynamic changes in both vegetation greenness and canopy biomass that are sensitive to seasonal changes in surface meteorology and land-atmosphere carbon exchange. This work was conducted at the University of Montana and Jet Propulsion Laboratory under contract to NASA (NNH07ZDA001N-TE). August 2005 Enhanced Data Availability Correlation Results - VOD vs. NDVI, EVI, LAI, GSI Regional Phenology The MODIS VI and LAI retrievals are constrained by signal degradation and data loss from solar illumination effects, clouds, smoke and other atmospheric effects, even at relatively coarse 16-day time intervals. The AMSR-E 10.65GHz VOD retrievals are less constrained by these effects, resulting in a large improvement in non gap-filled, 16-day data time series. Tropical regions susceptible to frequent cloud cover show considerable increases in microwave data availability over the 16-day best QC MODIS EVI series. The high VOD retrieval rate allows for relatively complete pixel-wise, non-gap filled yearly phenologies over these regions. However, seasonal snow cover and frozen conditions limit the VOD retrievals over northern latitudes and higher elevations, while snow and seasonal reductions in solar illumination limit the VI time series. The VOD global correlation maps (at left) are strongly impacted by spatial and temporal gaps in the VI and LAI time series. To mitigate these impacts and isolate and compare aggregate seasonal phenology patterns of the major biomes, spatially contiguous regions of relatively uniform land cover and climate were defined and nine regions were selected covering a range of biomes, latitudes and continents. The resulting 16-day time series of each regional mean dataset (VOD, NDVI, EVI, LAI, GSI) are plotted for the six year (2003 to 2008) study period (below). VOD - EVI VOD - NDVI EVI VOD - GSI VOD - LAI AMSRE Vegetation Optical Depth MODIS NDVI MODIS EVI LAI, GSI as labeled Percent of Total Available Best QC 16-Day Data (2003-2008) IGBP Barren Land Cover Class GSI = 1; Year round unconstrained growing season 0 – 20% 21-40% 41-60% 61-80% 81-100% R-value IGBP Barren Land Cover Class VOD Pixel-wise linear correlations were computed between the AMSR-E VOD, GSI and MODIS EVI, NDVI and LAI time series over the 6 year (2003-2008) study period. The resulting correlations are summarized by land cover type (Table) for homogeneous pixels (25km pixel > 80% homogeneous) as well as VOD and LAI means. Land cover classes with characteristically low biomass levels (e.g. savannas, grasslands) show the highest correlations, with decreasing correspondence for higher canopy density and biomass levels. The Growing Season Index (GSI; Jolly, et al. 2005) is a bioclimatic phenology model that uses daily air temperature, atmospheric vapor pressure deficit and photoperiod as primary constraints to vegetation growth and is independent of satellite derived indices. Jolly, W. M., et al. (2005), A generalized, bioclimatic index to predict foliar phenology in response to climate, Global Change Biology, 11, 619-632. -1.0 -.75 -.5 -.25 .25 .5 .75 1.0 A B C Phenology signals from AMSR-E VOD & MODIS EVI and NDVI over three tropical (EBF) pixels. C B A Tower Fluxes and VOD At Grassland/Woody Savanna sites (mean of two towers within same 25km pixel) a VOD increase coincides with an early season rise in ecosystem respiration before onset of significant GPP. The Deciduous Broadleaf site shows similar early season VOD variation with ecosystem respiration, but the AMSR-E VOD signal may suffer from vegetation biomass saturation (mid-season trough). At the Evergreen Needleleaf site, VOD variability corresponds well with both ecosystem respiration and GPP GRA/WSV – Vaira Ranch (-120.95 Lon, 38.41 Lat) Tonzi Ranch, CA (-86.41 Lon, 39.32 Lat) DBF - Morgan Monroe SF, Indiana (-86.41 Lon, 39.32 Lat) ENF - UCI 1850 Burn Site, Manitoba (-98.48 Lon, 55.88 Lat) Jones, L.A., J. S. Kimball, K.C. McDonald, S. K. Chan, E. G. Njoku, 2009a. A method for deriving northern hemisphere vegetation phenology, land surface wetness, and open water fraction from AMSR-E. Presented at IGARSS Symp., Cape Town, South Africa, Jul 13-17 Jones, L.A., C. R. Ferguson, J. S. Kimball, K. Zhang, S. K. Chan, E. G. Njoku, E. F. Wood. 2009b. Satellite Microwave Remote Sensing of Daily Land Surface Air Temperature Minima and Maxima from AMSR-E. IEEE J-STARS (in review).


