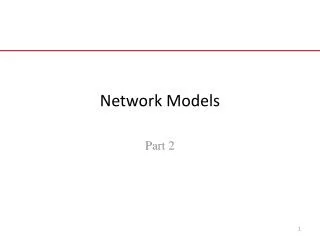
One Network, Different Models
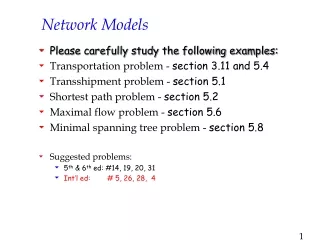
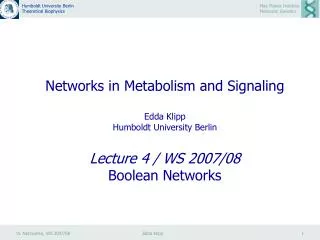
Networks in Metabolism and Signaling Edda Klipp Humboldt University Berlin Lecture 4 / WS 2007/08 Boolean Networks. gene a. gene b. gene c. gene d. C. A. D. B. A. B. +. +. One Network, Different Models. transcription. translation. repression. activation. gene. protein.

One Network, Different Models
E N D
Presentation Transcript
Networks in Metabolism and Signaling Edda Klipp Humboldt University BerlinLecture 4 / WS 2007/08Boolean Networks
gene a gene b gene c gene d C A D B A B + + One Network, Different Models transcription translation repression activation gene protein Directed graphs Bayesian network Boolean network a b a b a b c d c d c d p(xa) a(t+1) = a(t) p(xb) b(t+1) = (not c(t)) and d(t) V = {a,b,c,d} p(xc|xa,xb), c(t+1) = a(t) and b(t) E = {(a,c,+),(b,c,+), (c,b,-),(c,d,-),(d,b,+)} p(xd|xc), d(t+1) = not c(t)
Simplification of Gene Expression Regulation Protein Protein Transcription Factor mRNA mRNA Gene Gene A B C D E F G
Boolean Network • Boolean network is • - a directed graph G(V,E) • characterized by • the number of nodes („genes“): N • the number of inputs per node (regulatory interactions): k A B E D C G F N=7, kA=0, kB=1, kC=2,… in-degrees
Boolean Logic Boolean models are discrete (in state and time) and deterministic. (George Boole, 1815-1864) Each gene can assume one of two states: expressed („1“) or not expressed („0“) Background: Not enough information for more detailed description Increasing complexity and computational effort for more specific models Replacement of continuous functions (e.g. Hill function) bystep function
Boolean Network Boolean networks have always a finite number of possible states: 2N and, therefore, a finite number of state transitions: A B E D C G F N=7, 27 states, theoretically possible state transition
Dynamics of Boolean NetworkS The dynamics are described by rules: „if input value/s at time t is/are...., then output value at t+1 is....“ A B A(t) B(t+1)
Boolean Models: Truth functions A B A(t) B(t+1) in output 0 0 0 1 1 1 0 1 0 1 p p not p rule 0 1 2 3 B(t+1) = not (A(t)) rule 2
Dynamics of Boolean Networks with k=1 Linear chain A B C D A fixed (no input). Rules 0 and 3 not considered (since independence of input). A(t) B(t+1) B(t+1) C(t+2) C(t+2) D(t+3) The system reaches a steady state after N-1 time steps.
Dynamics of Boolean Networks with k=1 A A B Ring B C D Again: Rules 0 and 3 not considered (since independence of input). A B A B A B A B 0 0 1 0 0 1 1 1 0 0 0 1 1 0 1 1 0 0 1 0 0 1 1 1 A(t+1)=B(t) B(t+1)=A(t) Both rule 1 Fixpoint or cycle of length 2 depending on initial conditions Cycle of length 4 independent of initial conditions. A B A B A B A B 0 0 1 0 0 1 1 1 1 0 1 1 0 0 0 1 1 1 0 1 1 0 0 0 0 1 0 0 1 1 1 0 0 0 1 0 0 1 1 1 A(t+1)=not B(t) B(t+1)=A(t) Both rule 1
Attractor The trajectory connects the successive states for increasing time. An attractor is a region of a dynamical system's state space that the system can enter but not leave, and which contains no smaller such region (a special trajectory). Fixpoint – cycle of length 1 Cycles of length L Basin of attraction: is the surrounding region in state space such that all trajectories starting in that region end up in the attractor. Bifurcation: appearance of a boarder separating two basins of attraction.
Boolean Models: Truth functions k=2 A C(t+1) = not (A(t)) and B(t) rule 4 C B input output p q p=A(t), q=B(t)
Example Network Current Next state state 000 000 001 001 010 010 011 010 100 011 101 011 110 111 111 111 Three genes X, Y, and Z Y X Z 000 001 010 011 Rules X(t+1) = X(t) and Y(t) Y(t+1) = X(t) or Y(t) Z(t+1) = X(t) or (not Y(t) and Z(t)) 100 101 110 111
Example Network Y 000 001 010 011 Z X 100 101 110 111 - The number of accessible states is finite, . - Cyclic trajectories are possible. - Not every state must be approachable from every other state. - The successor state is unique, the predecessor state is not unique.
gene a gene b gene c gene d C A D B A B + + Example Network as Boolean Model transcription translation repression activation gene protein Boolean network a(t+1) = a(t) b(t+1) = (not c(t)) and d(t) a b c(t+1) = a(t) and b(t) c d d(t+1) = not c(t)
Example Network as Boolean Model Boolean network 0000 0001 0001 0101 0010 0000 0011 0000 0100 0001 0101 0101 0110 0000 0111 0000 1000 1001 1001 1101 1010 1000 1011 1000 1100 1011 1101 1111 1110 1010 1111 1010 a b c d a(t+1) = a(t) b(t+1) = (not c(t)) and d(t) c(t+1) = a(t) and b(t) d(t+1) = not c(t) Steady state: 0101 Cycle: 1000 1001 1101 1111 1010 1000
Naïve Reconstruction of Boolean Models • If it is known • -the number of vertices, N, and • -the number of inputs per vertex, k, • As well as a sufficient set of successive states, one can reconstruct the • network • List • List for each vertex all possible input combinations • List all respective outputs • Experiments: • - Delete after every “experiment” all “wrong” entries of the list
2 A B 1 Naïve Reconstruction of Boolean Models Input Output A(A),B(A) A B rule 0 0 0 1 0 2 0 3 1 0 1 1 1 2 1 3 2 0 2 1 2 2 2 3 3 0 3 1 3 2 3 3 0 0 0 0 0 0 0 1 0 1 0 0 0 0 0 1 0 1 1 0 1 0 1 1 1 1 1 0 1 0 1 1 1 1 0 1 0 0 0 0 0 1 0 1 0 0 0 0 0 1 0 1 1 0 1 0 1 1 1 1 1 0 1 0 1 1 1 1 1 0 0 0 0 1 0 0 0 1 1 0 1 1 1 0 1 1 0 0 0 1 0 0 0 1 1 0 1 1 1 0 1 1 1 1 0 0 0 1 0 0 0 1 1 0 1 1 1 0 1 1 0 0 0 1 0 0 0 1 1 0 1 1 1 0 1 1 A B N=2, k=1 In out 0 0 0 1 1 1 0 1 0 1 rule 0 1 2 3 Input Output A(B),B(B) A B rule 0 0 0 1 0 2 0 3 1 0 1 1 1 2 1 3 2 0 2 1 2 2 2 3 3 0 3 1 3 2 3 3 0 0 0 0 0 0 0 1 0 1 0 0 0 0 0 1 0 1 1 0 1 0 1 1 1 1 1 0 1 0 1 1 1 1 0 1 0 0 0 1 0 0 0 1 1 0 1 1 1 0 1 1 0 0 0 1 0 0 0 1 1 0 1 1 1 0 1 1 1 0 0 0 0 0 0 1 0 1 0 0 0 0 0 1 0 1 1 0 1 0 1 1 1 1 1 0 1 0 1 1 1 1 1 1 0 0 0 1 0 0 0 1 1 0 1 1 1 0 1 1 0 0 0 1 0 0 0 1 1 0 1 1 1 0 1 1 Input Output A(A),B(B) A B rule 0 0 0 1 0 2 0 3 1 0 1 1 1 2 1 3 2 0 2 1 2 2 2 3 3 0 3 1 3 2 3 3 0 0 0 0 0 0 0 1 0 1 0 0 0 0 0 1 0 1 1 0 1 0 1 1 1 1 1 0 1 0 1 1 1 1 0 1 0 0 0 1 0 0 0 1 0 0 0 1 0 0 0 1 1 0 1 1 1 0 1 1 1 0 1 1 1 0 1 1 1 0 0 0 0 0 0 1 0 1 1 0 1 0 1 1 1 1 0 0 0 0 0 1 0 1 1 0 1 0 1 1 1 1 1 1 0 0 0 1 0 0 0 1 1 0 1 1 1 0 1 1 0 0 0 1 0 0 0 1 1 0 1 1 1 0 1 1 “Experimente….” In Out A B A B 0 0 0 1 0 1 1 1 1 0 0 0 1 1 1 0 Input Output A(B),B(A) A B rule 0 0 0 1 0 2 0 3 1 0 1 1 1 2 1 3 2 0 2 1 2 2 2 3 3 0 3 1 3 2 3 3 0 0 0 0 0 0 0 1 0 1 0 0 0 0 0 1 0 1 1 0 1 0 1 1 1 1 1 0 1 0 1 1 1 1 0 1 0 0 0 0 0 1 0 1 1 0 1 0 1 1 1 1 0 0 0 0 0 1 0 1 1 0 1 0 1 1 1 1 1 0 0 0 0 1 0 0 0 1 0 0 0 1 0 0 0 1 1 0 1 1 1 0 1 1 1 0 1 1 1 0 1 1 1 1 0 0 0 1 0 0 0 1 1 0 1 1 1 0 1 1 0 0 0 1 0 0 0 1 1 0 1 1 1 0 1 1
Random Boolean Networks If the rules for updating states are unknown select rules randomly Rule 0 Rule 2 Rule 2 Rule 1 ½ pN (N-1) edges N nodes
Kauffman’s NK Boolean Networks An NK automaton is an autonomous random network of N Boolean logic elements. Each element has K inputs and one output. The signals at inputs and outputs take binary (0 or 1) values. The Boolean elements of the network and the connections between elements are chosen in a random manner. There are no external inputs to the network. The number of elements N is assumed to be large. S.A. Kauffman, 1969, J Theor Biol. Metabolic Stability and Epigenesis in Randomly Constructed Genetic Nets S. A. Kauffman. The Origins of Order: Self-Organization and Selection in Evolution, Oxford University Press, New York, 1993. S.A. Kauffman, 2003, PNAS, Random Boolean Network Models and the Yeast Transcriptional Network
Kauffman’s NK Boolean Networks An automaton operates in discrete time. The set of the output signals of the Boolean elements at a given moment of time characterizes a current state of an automaton. During an automaton operation, the sequence of states converges to a cyclic attractor. The states of an attractor can be considered as a "program" of an automaton operation. The number of attractors M and the typical attractor length L are important characteristics of NK automata.
Kauffman’s Boolean Network Fundamental question: require metabolic stability and epigenesis the genetic regulatory circuits to be precisely constructed?? Has fortunate evolutionary history selected only nets of highly ordered circuits which alone insure metabolic stability; Or are stability and epigenesis, even in nets of randomly interconnected regulatory circuits, to be expected as the probable consequence of as yet unknown mathematical laws? Are living things more akin to precisely programmed automata selected by evolution, or to randomly assembled automata…? Note: cellular differentiation despite identical sets of genes
Further Properties K connections: 22K Boolean input functions Nets are free of external inputs. Once, connections and rules are selected, they remain constant and the time evolution is deterministic. Earlier work by Walker and Ashby (1965): same Boolean functions for all genes: Choice of Boolean function affects length of cycles: “and” yields short cycles, “exclusive or” yields cycles of immense length
Further Properties: Cycles State of the net: Row listing the present value of all N elements (0 or 1) Finite number of states (2N) as system passes along a sequence of states from an arbitrary initial state, it must eventually re-enter a state previously passed a cycle Cycle length: number of states on a re-enterant cycle of behavior Cycle of length 1 – equilibrial state Transient (or run-in) length: number of state between initial states and entering the cycle Confluent: set of states leading to or being part of a cycle
Further Properties: Number of Cycles Such a net must contain at least one cycle, it may have more. There number can be counted just be releasing the net from different initial states No state can diverge on to two different states, no state can be on two different cycles
Further Properties: Number of Cycles (a) A net of three binary elements, each of which receives inputs from the other two. The Boolean function assigned to each element is shown beside the element. (b) All possible states of the 3-element net are shown in the left 3 x 8 matrix below T. The subsequent state of the net at time T+ 1, shown in the matrix on the right, is derived from the inputs and functions shown in (a). (c) A kimatograph showing the sequence of state transitions leading into a state cycle of length 3. All states lie on one confluent. There are three run-ins to the single state cycle.
Example: Net with N=10 Periodic attractor (yellow) and basin of attraction (cyan)
Example: Net with N=10 The entire state space of an RBN with 10 nodes. Note: Self connections do not appear so a period-1 attractor appears to have no outputs although each network state must have exactly one output.
Further Properties: Distance Distance compares two states of the net Can be defined as the number of genes with different values in two states. For example N=5: state (00000) and state (00111) differ in the value of three elements This is used as measure of dissimilarity between - subsequent states on a transient - subsequent states on a cycle - cycles
Totally Connected Nets, K=N Is like random mapping of a finite set of numbers into itself. Expected length of cycle is E.g. net with N=200 2200 states expected cycle length 2100 ~ 1030 Compare to Hubbel’s age of the universe: 1023 If every transition would take only a second…. Such networks are biologically impossible
One Connected Nets, K=1 Either one cycle of length N Or a number of disconnected cycles for the full systems state cycles lengths are lowest common multiples of the individual loop lenghts the state cycle length becomes easily very large Again biologically not feasible
Two Connected Nets, K=2 Kauffman studied networks of N= 15, 50, 64,…, 400, 1024, .., 8191 Nets of 1000 elements possess 21000~10300 states 16 Boolean functions Study of cycle length (surprisingly short)
Two Connected Nets, K=2: Cycle Length (a) A histogram of the lengths of state cycles in nets of 400 binary elements which used all 16 Boolean functions of two variables equiprobably. The distribution is skewed toward short cycles. (b) A histogram of the lengths of state cycles in nets of 400 binary elements which used neither tautology nor contradiction, but used the remaining 14 Boolean functions of 2 variables equiprobably. The distribution is skewed toward short cycles.
Two Connected Nets, K=2: Cycle Length Log median cycle length as a function of log N, in nets using all 16 Boolean functions of two inputs (all Boolean functions used), and in nets disallowing these two functions (tautology and contradiction not used). The asymptotic slopes are about 0.3 and 0.6.
K=2: Transient Lengths A scattergram of run-in length and cycle length in nets of 400 binary elements using neither tautology nor contradiction. Run-in length appears uncorelated with cycle length. A log/log plot was used merely to accommodate the data.
K=2: Number of Cycles A histogram of the number of cycles per net in nets of 400 elements using neither tautology nor contradiction, but the remaining Boolean functions of two inputs equiprobably. The median is 10 cycles per net. The distribution is skewed toward few cycles. Expected number of cycles:
K=2: Activity After release from an arbitrary initial state: Number of elements changing their state per state transition decreases Example: net of 100 elements first step: about 0.4 N elements change exponential decay of this number minimum activity 0 to 0.25 N On a cycle: 0 to 35 of 100 elements change most genes are constant during a cycle Bis hier 12. Nov 2007
Noise • One unit of noise may be introduced by arbitrarily changing the value of a single gene for one time moment. • The system may return to the cycle perturbed or run into a different cycle. In a net of size N there are just N states which differ from any state in the value of just one gene Consider a net with several cycles: By perturbing all states on each cycle (distance 1) one obtains a matrix listing all cycles and how often they are reached from another one. By dividing all cells by the rows totals transition probabilities The matrix is a Markov chain.
Noise: for the Example Boolean network Cycle 1 0000 0001 0001 0101 0010 0000 0011 0000 0100 0001 0101 0101 0110 0000 0111 0000 Cycle 2 1000 1001 1001 1101 1010 1000 1011 1000 1100 1011 1101 1111 1110 1010 1111 1010 a b c d a(t+1) = a(t) b(t+1) = (not c(t)) and d(t) c(t+1) = a(t) and b(t) Cycle: 1000 1001 1101 1111 1010 1000 d(t+1) = not c(t) Steady state: 0101 Transition Matrix C1 C2 C1 ¾ ¼ C2 ¼ ¾
Noise (a) A matrix listing the 30 cycles of one net and the total number of times one unit of perturbation shifted the net from each cycle to each cycle. The system generally returns to the cycle perturbed. Division of the value in each cell of the matrix by the total of its row yields the matrix of transition probabilities between modes of behavior which constitute a Markov chain. The transition probabilities between cycles may be asymmetric. (b) Transitions between cycles in the net shown in (a). The solid arrows are the most probable transition to a cycle other than the cycle perturbed, the dotted arrows are the second most probable. The remaining transitions are not shown. Cycles 2, 7, 5 and 15 form an ergodic set into which the remaining cycles flow. If all the transitions between cycles are included, the ergodic set of cycles becomes: 1, 2, 3, 5, 6, 12, 13, 15, 16. The remainder are transient cycles leading into this single ergodic set-.
Noise The total number of cycles reached from each cycle after it was perturbed in all possible ways by one unit of noise correlated with the number of cycles in the net being perturbed. The data is from nets using neither tautology nor contradiction, with N = 191, and 400.
Application to Cell Cycle Logarithm of cell replication time in minutes against logarithm of estimated number of genes for various single cell organisms and cell types. Solid lines: connects medium replication times of bacteria, protozoa, chicken, mouse, dog, and man.
Application to Cellular Differentiation The logarithm of the number of cell types is plotted against the logarithm of the estimated number of genes per cell, and the logarithm of the median number of state cycles is plotted against logarithm N. The observed and theoretical slopes are about 0.5. Scale: 2 x lo6 genes per cell = 6 x 10-12g DNA per cell.
Distance: the Derrida Plot Recurrence relation showing the expected distance DT+1 between two states at time T+1 after each is acted upon by the network at time T, as a function of the distance DT between the two states at time T. Distance is normalized to the fraction of elements in different activity values in the two states being compared. For K=2, the recurrence curve is below the 45x line, and hence the distance between arbitrary initial states decreases toward zero over iterations. For K>2, states that are initially very close diverge to an asymptotic distance given by the crossing of the corresponding K curve at the 45x line. Thus K>2 networks exhibit sensitivity to initial conditions and chaos, not order. Example: N=3, at T two states (000) and (001) – distance 1 (or 1/3 normalized) Transition to T+1 : (000)(100) and (001)(010) distance 2 (or 2/3)
Ordered and Chaotic Regimes Series of states: White: changing Black: not changing Edge of Chaos Chaotic regime Ordered regime
Kauffman’s NK Boolean NetworksDependence of Behavior on Degree K K large (K = N): the behavior is essentially stochastic. The successive states are random with respect to the preceding ones. The "programs" are very sensitive to minimal disturbances (a minimal disturbance is a change of an output of a particular element during an automaton operation) and to mutations (changes in Boolean element types and in network connections). The attractor lengths Lare very large: L ~ 2N/2. The number of attractors Mis of the order of N. If the connection degree K is decreased, this stochastic type of behavior is still observed, until K ~ 2.
Kauffman’s NK Boolean NetworksDependence of Behavior on Degree K At K ~ 2 the network behavior changes drastically. The sensitivity to minimal disturbances is small. The mutations create typically only slight variations an automaton dynamics. Only some rare mutations evoke the radical, cascading changes in the automata "programs". The attractor length Land the number of attractors M are of the order of 1/2N. This is the behavior at the edge of chaos, at the borderland between chaos and order.
Boolean Dynamics – Scale Free Nets Typical examples of directed networks are shown for the size of N = 64: (a),(b) random network with K = 2; (e),(f) scale-free network with <k>=2. We show same network by two kinds of representation. For (a) and (e) the nodes are located on the circumference with equal distance. For (b) and (f) the nodes are randomly distributed in the square. Each node is represented as a bold point with size in proportion to the number of the input links. We represent input(output)-side of the links with deep(faint) color such that the direction of a link is denoted by the color gradation from deep color(output) to faint color(input).