Download
1 / 1
10 likes | 152 Views
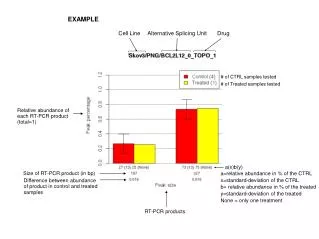
# of CTRL samples tested. # of Treated samples tested. EXAMPLE. Cell Line. Alternative Splicing Unit. Drug. Relative abundance of each RT-PCR product (total=1). a(x)b(y) a=relative abundance in % of the CTRL x=standard-deviation of the CTRL

E N D
# of CTRL samples tested # of Treated samples tested EXAMPLE Cell Line Alternative Splicing Unit Drug Relative abundance of each RT-PCR product (total=1) a(x)b(y) a=relative abundance in % of the CTRL x=standard-deviation of the CTRL b= relative abundance in % of the treated y=standard-deviation of the treated None = only one treatment Size of RT-PCR product (in bp) Difference between abundance of product in control and treated samples RT-PCR products