Tableau-vs-Excel-Choosing-Your-Data-Visualization-Tool
Compare Tableau and Excel for data visualization. Discover key differences to help you choose the right tool for your data needs.


Tableau-vs-Excel-Choosing-Your-Data-Visualization-Tool
E N D
Presentation Transcript
Tableau vs. Excel: Choosing Your Data Visualization Tool This presentation explores the strengths of Tableau and Excel for data visualization. We'll compare their features to help you choose the best tool for your analytical needs.
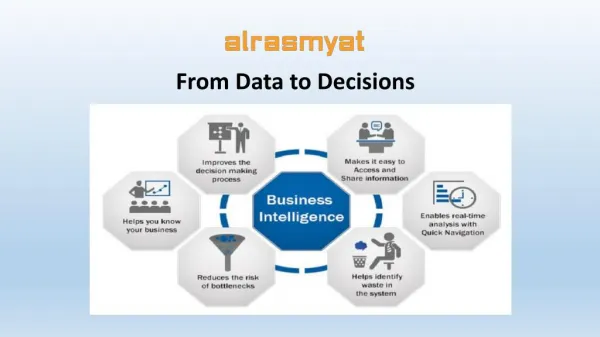
What is Data Visualization? Graphical Presentation Simplifies Complexity It makes complex datasets easy to understand for informed decisions. Visualizing data helps identify trends, patterns, and insights. Enhances Interpretation Visuals improve your ability to grasp important information efficiently.
Overview of Tableau Business Intelligence Tool Visual Correlations It uses color, size, labels, and shapes for context. Tableau creates interactive dashboards with ease. Low Knowledge Barrier Non-technical users can visualize data effectively.
Advantages of Tableau Outstanding Reporting Convenient dashboard customization for mobile and laptops. Easy Integration Integrates with Python or R for complex calculations. Handles Large Data Capable of processing and visualizing large datasets.
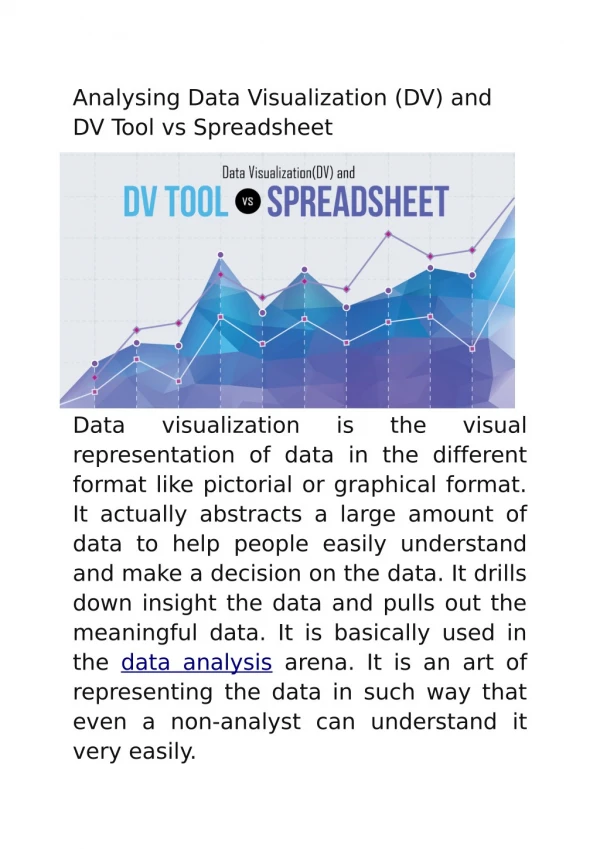
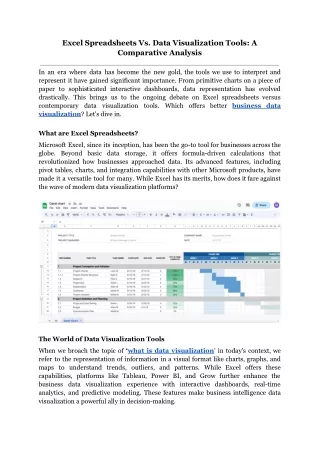
Overview of Excel Spreadsheet Application Performs calculations, statistical operations, and data analysis. Stores data in rows and columns, managed in cells.
Advantages of Excel Data Analysis Mathematical Functions Analyzes large data to identify trends for informed decisions. Performs tons of mathematical and logical functions easily.
Key Differences: Tableau vs. Excel Feature Tableau Excel Data Visualization Designed for visualizing and exploring data. Basic visualization features like charts and graphs. Data Preparation Limited, but connects with many data sources. Extensive, with cleaning, transformation, and modeling. Data Analysis Advanced with data blending and forecasting. Basic, offers pivot tables and statistical functions. Collaboration Real-time sharing and data analysis collaboration. Limited, with basic sharing and change tracking.
Tableau and Excel: Working Together Complementary Strengths Excel for data preparation, Tableau for advanced visualization. Enhanced Analytics Combine both for powerful data migration and analysis. Optimal Results Using them together offers great results for data scientists.
Contact us info@augmentedtechlabs.com (979)344-6508 https://www.augmentedtechlabs.com/