Download
1 / 1
40 likes | 168 Views
In tableau certification course you get complete knowledge on tableau desktop, server, and public. Interactive practical classes are given in Tableau training<br>https://onlineitguru.com/tableau-training.html<br><br>

E N D
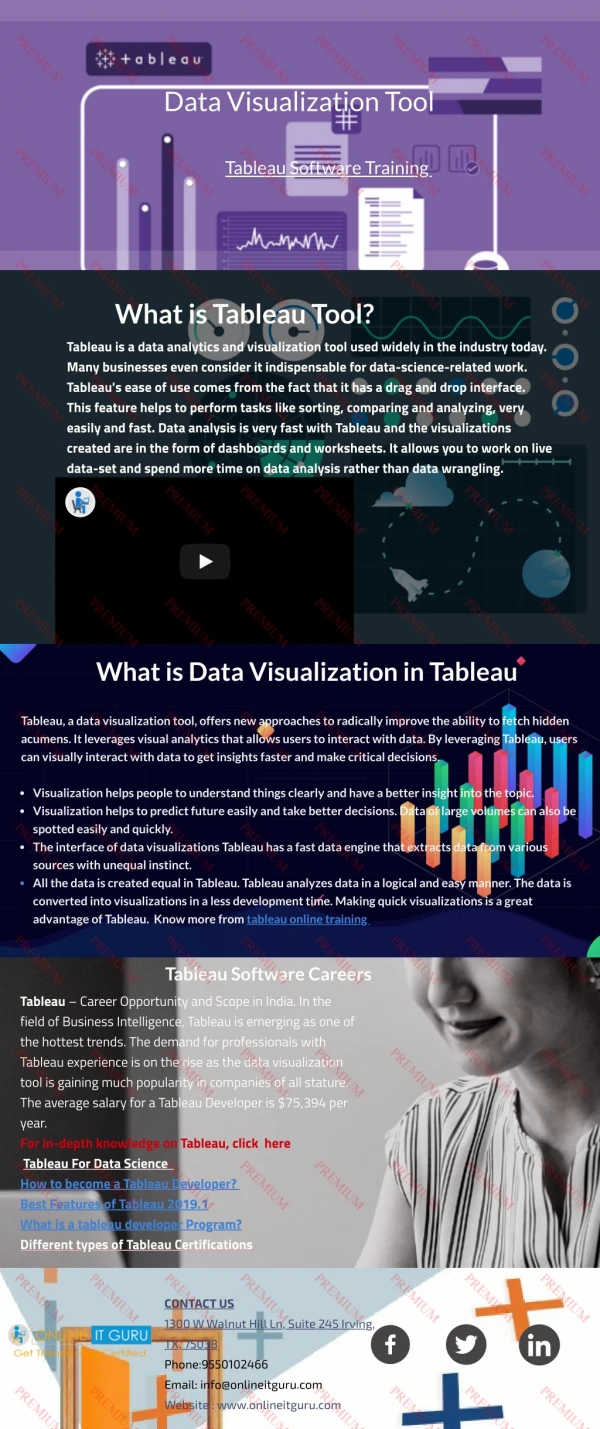
Data Visualization Tool Tableau Software Training What is Tableau Tool? Tableau is a data analytics and visualization tool used widely in the industry today. Many businesses even consider it indispensable for data-science-related work. Tableau's ease of use comes from the fact that it has a drag and drop interface. This feature helps to perform tasks like sorting, comparing and analyzing, very easily and fast. Data analysis is very fast with Tableau and the visualizations created are in the form of dashboards and worksheets. It allows you to work on live data-set and spend more time on data analysis rather than data wrangling. What is a Tableau Desktop? | Tableau t What is a Tableau Desktop? | Tableau t… … What is Data Visualization in Tableau Tableau, a data visualization tool, offers new approaches to radically improve the ability to fetch hidden acumens. It leverages visual analytics that allows users to interact with data. By leveraging Tableau, users can visually interact with data to get insights faster and make critical decisions. Visualization helps people to understand things clearly and have a better insight into the topic. Visualization helps to predict future easily and take better decisions. Data of large volumes can also be spotted easily and quickly. The interface of data visualizations Tableau has a fast data engine that extracts data from various sources with unequal instinct. All the data is created equal in Tableau. Tableau analyzes data in a logical and easy manner. The data is converted into visualizations in a less development time. Making quick visualizations is a great advantage of Tableau. Know more from tableau online training Tableau Software Careers Tableau – Career Opportunity and Scope in India. In the field of Business Intelligence, Tableau is emerging as one of the hottest trends. The demand for professionals with Tableau experience is on the rise as the data visualization tool is gaining much popularity in companies of all stature. The average salary for a Tableau Developer is $75,394 per year. For in-depth knowledge on Tableau, click here Tableau For Data Science How to become a Tableau Developer? Best Features of Tableau 2019.1 What is a tableau developer Program? Different types of Tableau Certifications CONTACT US 1300 W Walnut Hill Ln, Suite 245 Irving, TX, 75038 Phone:9550102466 Email: info@onlineitguru.com Website : www.onlineitguru.com