Data Analysis and Visualization with MS Excel
AVNI WADHWA CSE3. Course For non-Engineering majors. Information Technology (IT) fluency including Description: proficiency with certain computer applications (traditional computer literacy), principles on which you can build new understanding as IT

Data Analysis and Visualization with MS Excel
E N D
Presentation Transcript
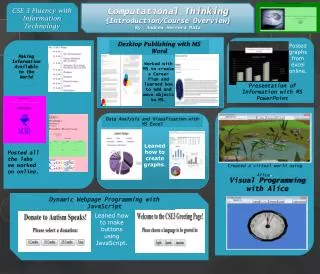
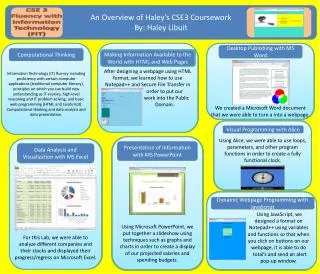
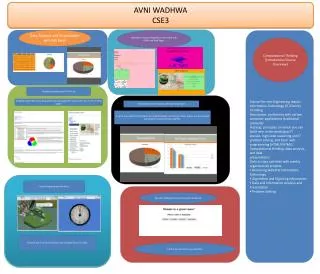
AVNI WADHWA CSE3 Course For non-Engineering majors. Information Technology (IT) fluency including Description: proficiency with certain computer applications (traditional computer literacy), principles on which you can build new understanding as IT evolves, high-level reasoning and IT problem solving, and basic web programming (HTML/XHTML). Computational thinking, data analysis, and data presentations. Daily in-class activities with weekly organized lab projects. • Becoming Skilled at Information Technology • Algorithms and Digitizing Information • Data and Information Analysis and Presentation • Problem Solving Computational Thinking [Introduction/Course Overview] Data Analysis and Visualization with MS Excel Making Information Available to the World with HTML and Web Pages Desktop Publishing with MS Word Using Microsoft Word, we designed these web pages that discuss the role of color in web pages. Presentation of Information with MS PowerPoint In Lab 5, we collected information and created graphs. We then put these graphs in a powerpoint presentation and saved it as a pdffile. Visual Programming with Alice Dynamic Webpage Programming with JavaScript In labs 6 and 7 we learned how to use multiple feature in Alice. In lab 8, we learned to use JavaScript.