
Process Capability: Key Concepts and Improvement Methodologies
E N D
Presentation Transcript
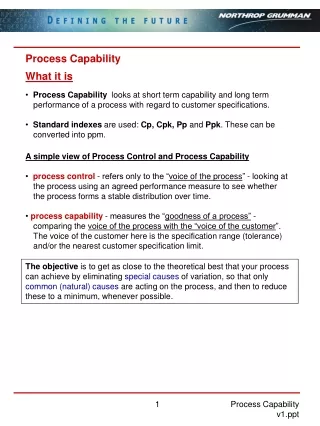
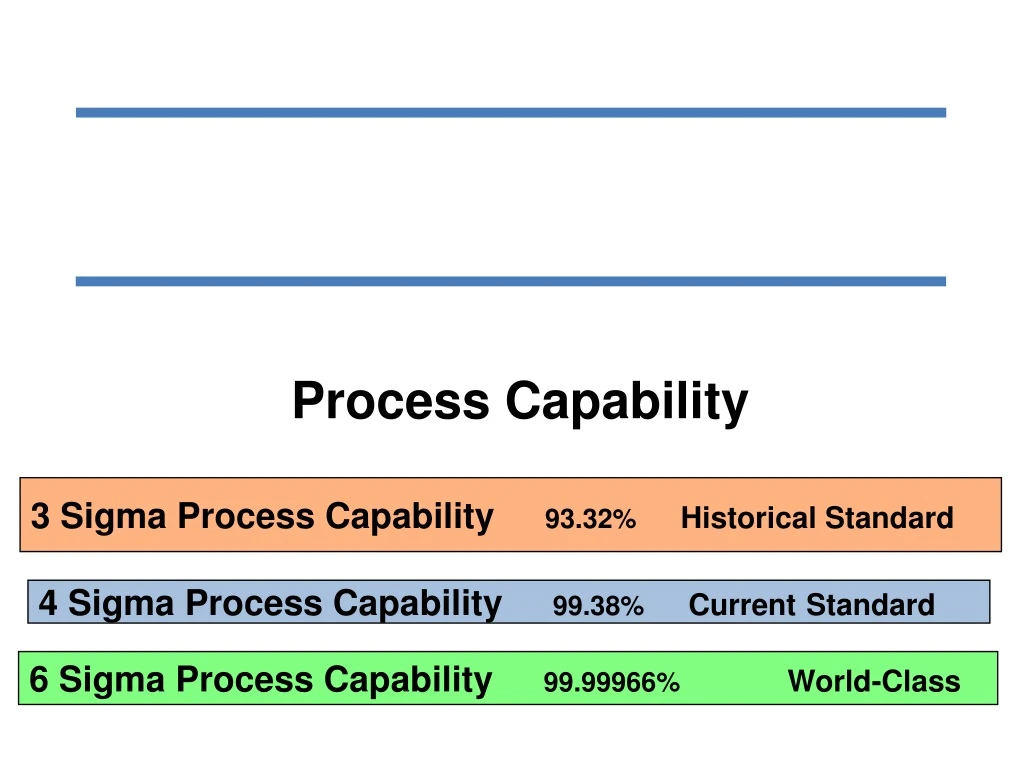
3 Sigma Process Capability 93.32% Historical Standard Process Capability 4 Sigma Process Capability 99.38% CurrentStandard 6 Sigma Process Capability 99.99966% World-Class
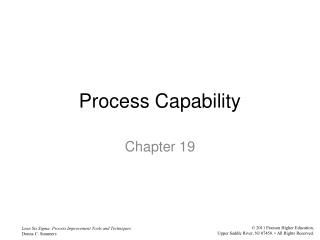
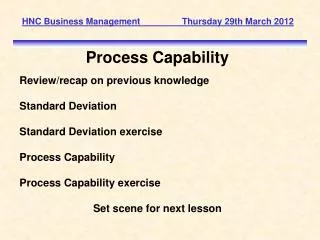
Process Capability What We're Going To Talk About • Concept of Process Capability • (Short-Term and Long-Term) • Improvement Methodology • Process Variation • Types of Limits • Capability Index • Process Capability Indices (Normal Distribution Data) • Process Performance Indices (Normal Distribution Data) • MINITAB Software capability data analysis out-put • Five key assumptions • Steps to study process capability & Process Controls
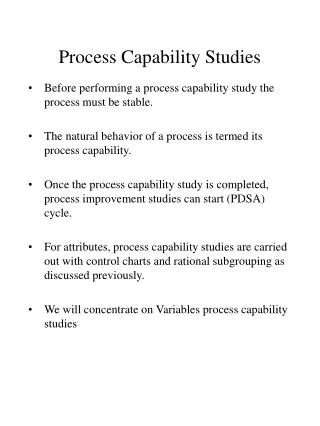
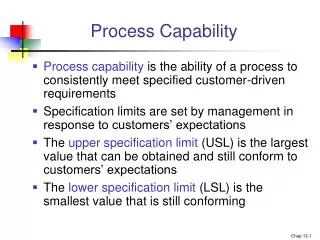
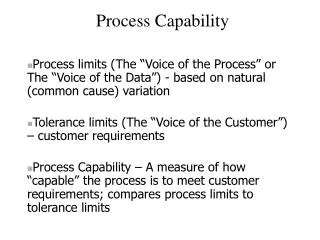
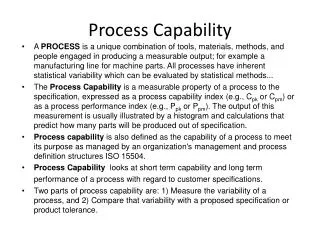
Process Capability Concept of Process Capability! • In quality planning, it is ensured that the process should be stable and capable to produce parts that meets the specifications. • Process capability is a concept that provides a quantified prediction of process effectiveness and adequacy • Quantitative prediction ability resulted in a widespread adoption of the concept as a major element of quality planning. • It is the measurement of variation on the product turned out by a process. Quality planning & analysis McGraw-Hill 4th edition
Process Capability What is process? • Process consists of a combination of Machine, Method, Material, Man, Environment and Gauge measurement (optional) engaged in production. (i.e. 4 Ms and 1E) • There is a need to separately identify the related variables and quantify the effect of them into the measurement. (e.g, temp. setting 40-50C, work instructions, material tensile strength, calipers) • Capability of the process refers to an ability, based on test performance results , to achieve the desired specification of the process. (e.g. Specs =4± 0.3mm) Quality planning & analysis McGraw-Hill 4th edition
Process Capability What is process? • Process consists of a combination of Machine, Method, Material, Man, Environment and Gauge measurement (optional) engaged in production. (i.e. 4 Ms and 1E) • There is a need to separately identify the related variables and quantify the effect of them into the measurement. (e.g, temp. setting 40-50C, work instructions, material tensile strength, calipers) • Capability of the process refers to an ability, based on test performance results , to achieve the desired specification of the process. (e.g. Specs =4± 0.3mm) Quality planning & analysis McGraw-Hill 4th edition
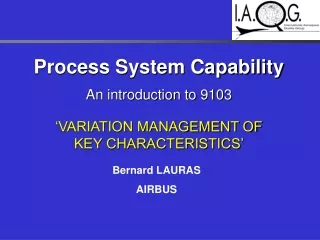
Improvement methodology Controllable Inputs ( machine setting, flow rate, feed quantity) X1 X2 X3 Output Characteristics: Output Variables (mm , psi, colouring) Input Variables: Raw materials, components, equipment, tooling, Operation methods, etc. The Process Y1, Y2, etc. N1 N2 N3 Uncontrollable Inputs ( humidity, temperature , skills) [KPIV] Key Process Input Variables Centering –The Process Is On Target Spread Variation Reduce On target, minimum process variation
Process Capability Overview Defects Defects LSL USL Key point :- Every process has inputs: Man, Method, Material, Machine (i.e. 4Ms) and Environment (1E) uncontrolled inputs These variables combined to give an output (i.e. Customer’s requirement.) By controlling the key inputs the output can achieve a more stable process with lesser variation and that is what the customers demand every time.
Why Process Capability Study Process capability provides a basic understanding for the production personnel on how the process behaves in relative to the process specifications. This gives an initial feel on how variability can affect the process and gives us some measurement metrics for quantifying that variability. Such studies provide information on what the process could do under its best operating conditions, by making improvement to the process to aim for its desired target .
Process Variation • Process variation is the differences among individual measurement or units produced by a process • Types of variation in a manufacturing process • Within the unit-(Positional variation) e.g. readings taken on the diameter at various positions along the shaft. • (2) Between units-(Cyclical variation) e.g. readings taken on different shafts diameters. • (3) Time to time- (Temporal variation) e.g. readings taken by • operators working on different shifts (i.e. Day, afternoon and night shifts) • (4) Measurement error- readings taken on some characteristics by different operators (i.e reproducibility) with the same measuring equipment (i.e. repeatability) on the same identified parts.
Understanding of Process Variation • Variation exists in everywhere even the best machine cannot make every unit exactly the same. • In many processes, nonconforming product can be produced due to excessive variability cause by human errors. (e.g. missing parts, wrong information , processing errors, inaccurate gauges, tool wear) measuring instruments). • Improved process capability becomes a necessity due to; • Design changes for improvement. • Costs reduction on material. • Customers demand on better quality products • All of this leads to the need for tighter control of tolerances with lower variation. • This means the ability to operate within tight specification limits, without producing defects becomes a competitive advantage.
Causes of Variation • Natural cause • Due to the cumulative effect of some unavoidable causes. • e.g. wear and tear of a cutting tool due to long usage • A process operating within natural or chance variation is said to be “in statistical control”. (i.e. all measurement readings are within the control limits of the control chart). Assignable causes have been eliminated.
Examples on natural causes • Natural causes • Vibration in the machine during running • Ambient temperature and humidity of the working environment • Normal wear and tear of machine parts due to prolong usage • Shifting of machine settings in a process • Computer response time. • Different human response to a traffic light system • Reduction of common causes • Change in process technology by the owner of the process. • Introduce Poka Yoke ( Error avoidance) system in the processes. to prevent operator mistakes.
Types of Variation 2. Special or assignable causes Examples • Incorrect setting adjustment on machine • Operators not following instructions • Defective or substandard raw material • Broken part due to fatique • Equipment malfunction • Wrong procedures adopted by operators • Poor product design • No maintenance on machines • Lack of understanding on operating procedures • Poor working conditions, e.g. poor lighting, noisy, dirty and non ventilation
Types of Variation An upward trend with the presence of assignable causes of variation look as follows.
Types of Variation Figure below shows both common cause and special cause variation A: Points dispersed away from target with some lying beyond control limits B: Points located beyong UCL C: Points shifting away from target out of UCL
Process Capability • Process capability is the natural reproducibility of a process’s output. It measures how well the process is currently behaving with respect to the output specifications. It refers to the uniformity of the process • Capability is often thought of in terms of the proportion of output that will be within product specification tolerances. The frequencies of defectives produced can be measured: • percentage (%) • parts per million (ppm) • parts per billion (ppb)
Process Capability • Process capability studies can: • Indicate the consistency of the process output interms of indices i.e. Cp , Cpk • Indicate the degree to which the output meets specification i.e. ppm , % rejection • Comparison with other process for improvement • Specification Limits vs Process capability: • Process is highly capable i.eCpk > 1.33 • Process is marginally capable i.eCpk 0.8 to 1.33 • Process is not capable i.eCpk < 0.80 Refer note book…for diagram…
Process Capability Stable vs Unstable Processes A stable (i.e.“in control”) process is one in which the key process output and finished product properties show no signs of assignable causes. An unstable (i.e.“out of control”) process has assignable (i.e special) causes present.
Process Capability Control Chart UCL CL COMMON CAUSE LCL 2 4 6 8 10 12 14 16 18 20 22 24 26 28 30 32 Run Order Control Chart and Control Limits • Thecontrol chartis the tool used to evaluate whether a process is or is not in a state of statistical control. • The control limits (i.e. UCL & LCL) represent the variation due to common cause. No points are beyond the control limits. Control Limits- often called “voice of the process” and used to identify special causes of variation.
Process Capability Specification Limits and Capable Processes Specification Limits – provided by the customer (referred to “voice of the customer”) are used to determine if the product meets a customer requirement. Usually given as LSL and/or USL. (e.g 4.00± 0.05 mm). A capable processis a stable process that demonstrates the ability to meet customer requirements. The process has to be reviewed from time to time to check for changes in stability and capability. When we refer to capability indices, we're comparing the process spread against thespecification tolerance. Cp = ( USL-LSL) / ( 6 ) For stability, we were comparing the process average drifting towards the control limits in the average chart.
Process Capability Abnormal variationdue to assignable sources Out ofcontrol UCL Mean Normal variationdue to chance LCL Abnormal variationdue to assignable sources 0 1 2 3 4 5 6 7 8 9 10 11 12 13 14 15 Sample number • If sample readings remained within the control limits, the process is considered as acceptable otherwise the process is “OUT OF CONTROL”
Three types of limits • Specification limits (LSL and USL) • These limits are created by design engineering in response to customer requirements to specify the manufacturing tolerance for a product’s characteristics. e.g . 4.2 (LSL) to 4.8 mm (USL) • Process limits (LPL and UPL) • These limits are used to measure the variation of a process. These are the 6 sigma limits of the measured characteristics. i.e. ±3
Three types of limits • Control limits (LCL and UCL) • These limits are computed from the measurements of the samples taken from the process. It measures the ± 3from the center of the process. Refer note book…for diagram…
Process capability computation This requires knowledge of the process average and standard deviation. These values are usually calculated based on the data collected from manufacturing process. using a statistical software or a calculator
Standard deviation The standard deviation measures the spread of the data about the mean value. It is useful for : 1. Comparison of data sets which have different quality characteristics. e.g. psi , cm, kg etc . ±1 covers 68.26% of the normal curve from µ ± 2 covers 95.45% of the normal curve from µ ± 3 covers 99.73% of the normal curve from µ 2. To check the consistency of the process e.g. A data set : 15, 15, 15, 14, 16. µ = 15 , =0.577 B data set : 2, 7, 14, 22, 30. µ = 15 , =9.200 B data set has a higher value. A data set has a low value and is consistent and better.
Standard deviation Standard deviation equation for an entire population: There are 100 parts produced by machine. In statistical terms this means we have a population of 100.
Standard deviation Equation used to estimate the population standard deviation where data is taken from a sample set. The number of readings or the number of values can be 8, 10, 12, 18, 20……..
Standard Deviation Calculation Case Study: (20 mins) 1. Find the standard deviation of the following data set: 4, 9, 11, 12, 17, 5, 8, 12, 14 2. Estimate the standard deviation of the population .
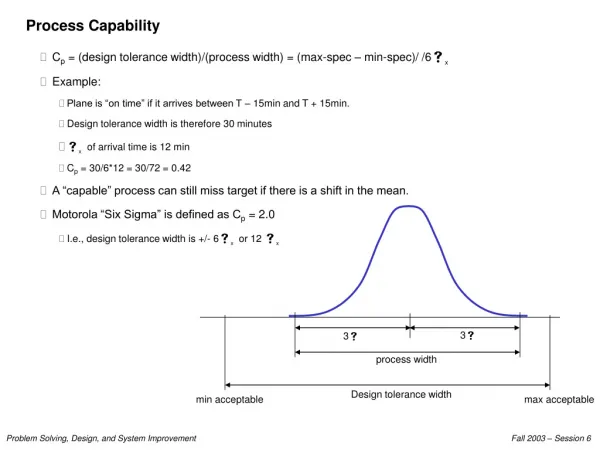
Process Capability Definition Definition of the capability indices It is an index which measures how close a process is running to its specification limits.(i.e.USL & LSL). The larger the index, the less likely the process will be outside the specification limits.. The capability of a process: Cp is defined as the ratio of the Specification Tolerance over the actual process spread.(6) Cpk is defined as the ratio of the distance from the process center to the nearest specifications limits divided by (3)
Measurement of Process Capability Three Measures of process capability • Three common types of indexes used in manufacturing processes • Cp and Cpk, • Used for measurement of process capability, the • minimum requirement is Cp & Cpk 1.33 for the • process to be capable. • 2. Pp and Ppk • Used as an indicator for process performance, the • minimum requirement is Pp & Ppk . 1.67 • 3. Cpm • Used for measurement of a process where the data • set has a non normal distribution with a target • setting on the process.
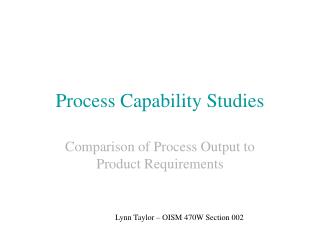
Interpretation of Indices Process capability and process performance indices • Cp and Cpk are capability indices which addressed both short and long term process capability. Short term implies the duration of investigation is limited. e.g. using an operator and a batch of raw material for the study. • Pp and Ppk are process performance indices which addressed long-term process performance for serial production which takes longer time and resources to monitor the process. • Cpm addressed the reduction of deviation by the process mean from a target value. These indices are applicable to the asymmetrical specification interval • e.g4.00 + 0.3 mm • - 0.2 mm
Process Capability Indices • Two common measures of process capability • Potential Capability Cp • Process Capability Cpk = Min {Cpu ,Cpl } An estimate is obtained of what the process can do under certain conditions, i.e., variability under short run and defined conditions for a process in a state of statistical control. The Cp index estimates the potential process capability when both specification limits are available. An estimate of process capability provides an insight of what the process is doing over a series of production run. A state of statistical is assumed. The Cpk is applicable for computation for single and double sided specification limits . Increasing the value of Cpk requires a reset of the process average back to the center of the specification and reduction in the process variation (i.e. standard deviation ).
Potential Capability Computation Potential Capability Index (Cp) The Cp index assesses whether the actual process spread (i.e. 6) of a manufacturing process is within the specification limits. Specification Tolerance USL- LSL Cp = ------------------------------- = --------------- Actual Process Spread 6 s This index is appropriate for the process cannot be centered between the specification limits e.g. tool wear off , liquid concentration depletion Refer note book…for diagram…
Relation of Cp to Rejection Rate A Cp index of 1.0 has indicated that a process is judged to be “capable”, i.e. if the process mean (µ) is centered within the specification tolerance, 0.27% of parts produced shall be rejected . Refer note book…for diagram…
Understanding of Process Capability Process Capability Index (Cpk) The Cpk index (i.e. min {cpl, cpu}) relates the deviation between process mean and the nearest specification limit. It shall be used for the process within statistical control. The data used for Cpk calculation should be obtained from the Average and range control charts. A negative Cpk indicates the quality characteristic measured is out of specification LSL USL Cpl Cpu µ Refer note book…for diagram…
Single Sided Specification Some manufacturing processes specifications are one sided. Example: 1. Purity of a product made from a chemical process requirement could be 98% concentration, i.e. LSL = 98% 2. Process specification could be stated such as “No more than 0. 3 mm runout on a shaft is allowed”. i.e. USL = 0.3 mm. The process capability can be applied to such cases by defining the following two equations. Refer note book…for diagram…
Single Sided Specification m - LSL USL - m CpL = CpU = 3s 3s Process with Lower Specs Limit (LSL) Process with Upper Specification Limits (USL) R-bar is obtained from range chart and d2 is a constant taken from the constant table = d2 Refer note book…for diagram…
Double Sided Specification Cpk = Minimum{ CpU, CpL } Cpk = Minimum { USL-µ , µ - LSL } --------- ---------- 3 3 Process with both LSL & USL Process mean = µ Standard deviation = (calculated from R-bar / d2 constant ) Upper Specs Limit = USL Lower Specs Limit = LSL
Relation of Cpk with Rejection Rate. Comment: Higher Cpk values yield lower fall out/reject rates and, as a result, are preferable
Cpk Interpretation Cpk < 1 – process is not capable (not acceptable) Cpk = 1 to 1.5 – process is capable Cpk > 1.5 – process is highly capable For industries (e.g . Automotive ) requirement Cpk 1.33 to be considered as process capability acceptable
Cpk Interpretation Cpk = negative number Cpk = zero Cpk = between 0 and 1 Cpk = 1 Cpk > 1
Process Performance Indices Process performance is usually measured by Ppk, which relates the long term capability of a process to meet process specifications. The estimated Ppk is defined as Specification Tolerance USL- LSL Pp = ------------------------------- = --------------- Total Process Spread 6 s where S = { ( x 2 ) - ( x ) 2 / n } ] [ n-1 ]
Comparison between Ppk and Cpk values For Cp and Cpk computation , the standard deviation ( ) is based on the average ranges of subgroups of the data, standard deviations of moving ranges, obtained from the control charts. This “within-subgroup” process variation can be considerably smaller than the overall standard deviation (s) estimate used in Ppk computation, especially when there are long-term trends in the data.
Interpretation on Process Variation Referring to Figure 18.14 above The figure shows four stages of process variation within the specification limits and the corrective actions to be taken when situation arises. Note In all situations , the average of the process has not drifted from the midpoint of the specification limits. There is a significant reduction in variation of the process spread which shows the process has improved from each of these stages.
Computer Software Application MINITAB Software Capability Analysis
Process Capability of thickness coat (% rej.) Before Process Improvement
Process Capability of thickness coat (% rej.) After process Improvement by process centering
Process Capability of coating thickness (% rej.) After process Improvement by reducing process variation.