Download
1 / 11
0 likes | 229 Views
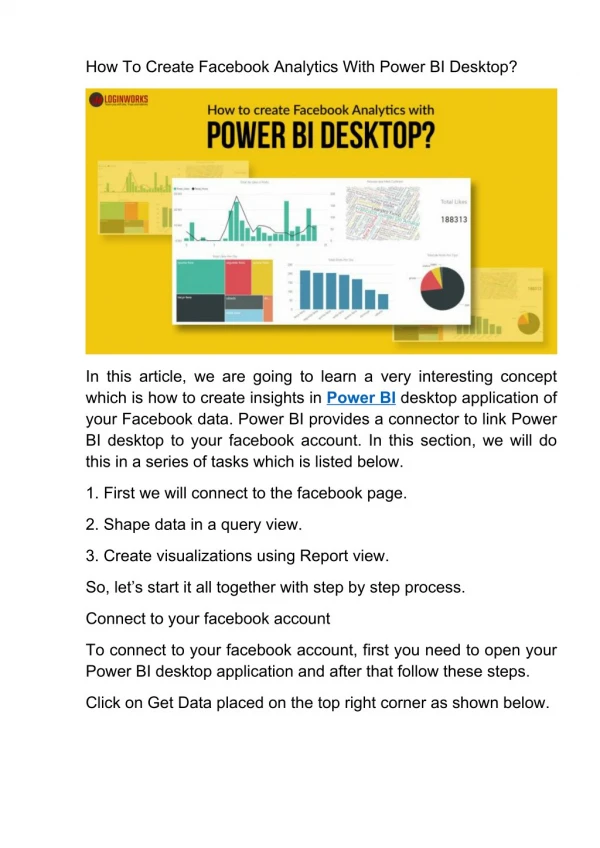
Power BI, a game-changer in data analytics, revolutionizes the way businesses interpret and leverage data. This Microsoft tool seamlessly integrates diverse data sources, offering dynamic visualizations and actionable insights. With user-friendly dashboards and real-time updates, Power BI empowers organizations to make informed decisions swiftly. Its intuitive interface facilitates even non-technical users in transforming raw data into meaningful narratives, fostering a data-driven culture. By simplifying complex analytics, Power BI enhances efficiency, accelerates decision-making, and propels

E N D
How Power BI Revolutionizes Data Analytics Discover the power of Microsoft's business analytics service and how it can transform your data into actionable insights.
Index • Introduction • Interactive Data Visualization • Effortless Data Integration • Data Exploration Made Easy • Collaboration and Sharing • Mobile Analytics • Self-Service Business Intelligence • Extensive Connectivity with Power Platform
Interactive Data Visualization Dynamic Dashboards Experience interactive data visualization with dynamic dashboards that bring your data to life. Easy Report Creation Create customized reports quickly and easily with an array of data visualization tools at your fingertips. Advanced Analytics Get in-depth insights with advanced analytics tools like heatmaps and clustering analysis.
Effortless Data Integration Seamless Integration Easy Data Transformation Effortlessly integrate data from various sources such as Excel spreadsheets, cloud services, and databases. Transform and shape raw data with Power BI's ETL process, which automates data preparation for analysis and visualization.
Data Exploration Made Easy 1 Drill-Down Capability Explore data in greater detail with drill-down capability that allows for simple and complex filtering options. 2 Natural Language Querying Use natural language to query data and receive instant results, allowing for faster decision-making. 3 Quick Insights Gain quick insights into your data with the click of a button, using Power BI's AI-driven automated insights feature.
Collaboration and Sharing Team Collaboration Cloud-Based Sharing Share dashboards and reports with your team and collaborate in real-time to drive decision-making. Share dashboards and reports with stakeholders outside your organization with secure, cloud-based sharing.
Mobile Analytics Mobile Access Mobile Optimized Access your data and reports on-the-go with Power BI mobile apps for iOS, Android, and Windows devices. Enjoy a fully optimized mobile experience with responsive dashboards and reports that adapt to any screen size.
Self-Service Business Intelligence 1 Empowered Decision-Making Empower decision-makers at all levels of your organization with self-service business intelligence tools. 2 Self-Sufficiency Reduce reliance on IT teams with Power BI's intuitive and user-friendly interface that requires little to no coding knowledge. 3 Scalable and Secure Ensure secure and scalable deployment across your organization with Power BI's enterprise-grade security and compliance features.
Extensive Connectivity with Power Platform Seamless Integration Multiple Connectors Connect Power BI with other Microsoft Power Platform tools like Power Apps and Power Automate to create seamless workflows. Access data from a wide range of external sources with Power BI's extensive library of built-in connectors.
FAQs: How Power BI Revolutionizes Data Analytics Q1: What is Power BI, and how does it differ from traditional analytics tools? A1: Power BI is a powerful business analytics tool by Microsoft that allows users to visualize and analyze data in real-time. Q2: How does Power BI enhance data visualization? A2: Power BI revolutionizes data visualization by offering a wide array of customizable charts, graphs, and dashboards. Q3: What sets Power BI apart in terms of accessibility and collaboration? A3: Power BI is cloud-based, enabling users to access their data and reports from anywhere, at any time. Q4: How does Power BI handle large datasets and ensure data accuracy? A4: Power BI is designed to handle large datasets efficiently. Its data modeling capabilities and compression algorithms enable quick processing of vast amounts of data without compromising accuracy.