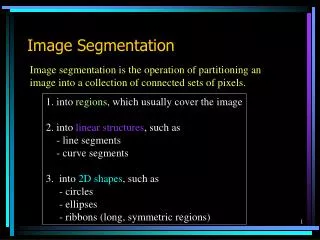
Optimization of Image Library Visualization and Layout for Enhanced User Interaction
This paper presents a novel approach to optimizing the visualization and layout of image libraries using the Personal Digital Historian (PDH) system. It explores context and user modeling to enhance image retrieval through content-based methods while minimizing visual clutter. Key techniques include polar coordinate layouts, PCA for dimensionality reduction, and cost functions to reduce overlap and deviation of displayed images. User-centered design principles are vital, incorporating user preferences and semantic understanding. Future work aims to refine automated layouts and improve image summarization.

Optimization of Image Library Visualization and Layout for Enhanced User Interaction
E N D
Presentation Transcript
Visualization & Layout for Image Libraries Baback Moghaddam, Qi Tian IEEE Int’l Conf. on CVPR 2001 Speaker:蘇琬婷 NCKU CSIE
Outline • System Introduction • Visualization and Layout Optimization • Context and User Modeling • Discussion NCKU CSIE
System Introduction-PDH • Personal Digital Historian (PDH) • Interface Design : • Polar coordinate visual layout • circular display area • touch sensitive table surface • top projection table with a whiteboard as the table surface NCKU CSIE
PDH Table NCKU CSIE
4W’s: The Organization Principal What Where When Who NCKU CSIE
Content-based Visualization • Contend-based Image Retrieval(CBIR) • Images would be indexed by their visual contents • Feature(content) extraction • Visualization • Traditional interfaces • PCA Splats • Display optimization NCKU CSIE
Traditional Systems • Visualization • Simple 1-D list • Sorted by decreasing similarity to the query • Drawback • Relevant images can appear at separate and distant locations in the list • Improvement • 2-D display technique NCKU CSIE
Top 20 Retrieved Images • Ranked top to bottom and left to right NCKU CSIE
PCA Splats • Principal component analysis(PCA) • project the images from the high-dimensional feature space to the 2-D screen • 37 visual features(color, texture, structure) • on the basis of the first two principal components normalized by the respective eigenvalues • The maximum distance preservation from the original high-dimensional feature space to 2-D space NCKU CSIE
Display Optimization • The drawback of PCA splat • images are partially or totally overlapped • Optimization • Minimizing overlap (decreasing the overlap of the images) • Minimizing deviation (deviating as little as possible from their initial PCA splat positions) • Minimizing the total cost NCKU CSIE
Cost Function F(p) : cost function of the overall overlap G(p) :cost function of the overall deviation from the initial image positions S : scaling factor and S = (N-1)/2 N : the number of images λ: weight and λ≧ 0 NCKU CSIE
i j Minimizing Overlap ri : image size is represented by its radius ,i = 1,…,N (xi, yi) : image center coordinates u : measure of overlapping σf : curvature-controlling factor range of F(p): (N-1)+(N-2)+…+1 = N(N-1)/2 NCKU CSIE
Minimizing Deviation :the optimized and initial center coordinates of the ith image, respectively v : measure of deviation σg : curvature-controlling factor range of G(p) : N range of F(p) : N(N-1)/2 ∴S = (N-1)/2 NCKU CSIE
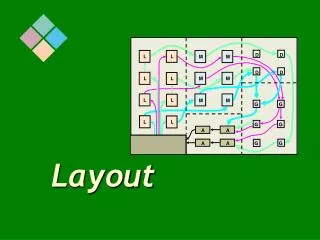
Optimized PCA Splat NCKU CSIE
Context and User Modeling • Image content and “meaning” is ultimately based on semantics • user’s notion of content : high-level concept • visual features : low-level concept NCKU CSIE
Context and User Modeling • User modeling or “context awareness” • constantly be aware of and adapting to the changing concepts and preferences of the users • learn from a user-generated layout • a novel feature weight estimation scheme : α-estimation • α: weighting vector for feature (color, texture, structure) • α = (αc, αt, αs)T • αc,t,s : the weight for color, texture, structure • αc + αt + αs = 1 NCKU CSIE
Estimation of Feature Weights Xc, t, s : Lc, t, s × Nmatrix where the ith column is the color, texture, structure feature vector of the ith image, i = 1,…,N Lc, t, s : the lengths of color, texture, structure features dij : the distance Euclidean-based between the ith image and the jth image • minimizing with an Lp norm (with p = 2) • non-negative least squares solutions NCKU CSIE
an example of a user-guided layout αc = 0.3792 αt = 0.5269 αs = 0.1002 NCKU CSIE
PCA splat on larger set of images estimated weight randomly generated weight NCKU CSIE
user-guided layout computer layout User Modeling for Automatic Layout NCKU CSIE
Future Work • Having the system learn the feature weights from various sample layouts provided by the user • Incorporate visual features with semantic labels for both retrieval and layout • Incorporation of relevance feedback • Automatic “summarization” and display of large image collections NCKU CSIE