Download
1 / 63
630 likes | 796 Views
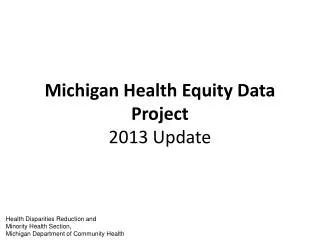
Michigan Health Equity Data Project 2013 Update. Michigan Health Equity Roadmap Recommendations 1-5. Michigan Health Equity Roadmap, MDCH. Michigan Health Equity Roadmap Recommendation #1. Michigan Health Equity Roadmap, MDCH. Michigan Population (2010). Native Hawaiian/ OPI.

E N D
Michigan Health Equity Roadmap Recommendations 1-5 Michigan Health Equity Roadmap, MDCH
Michigan Health Equity Roadmap Recommendation #1 Michigan Health Equity Roadmap, MDCH
Michigan Population (2010) Native Hawaiian/ OPI Two or more races Arab American Hispanic/ Latino Arab American (1.6%) Other (98.4%) African American Other Asian American African American (13.9%) American Indian (0.6%) American Indian Asian American (2.4%) Hispanic/Latino (4.4%) Native Hawaiian/OPI (0.1%) White White (76.5%) Two or more races (2.1%) Health Disparities Reduction and Minority Health Section Data Source: U.S. Census Bureau, 2010 American Community Survey
Median Annual Household Income, Michigan 2008-2010 All-State=$46,861 2008-10 American Community Survey, U.S. Census Bureau
Percent of Female-Headed Households,Michigan 2008-2010 All-State=7.4% 2008-10 American Community Survey, U.S. Census Bureau
Percent of Population Living Below Federal Poverty Level,Michigan 2008-2010 All-State=15.7% 2008-10 American Community Survey, U.S. Census Bureau
Percent of Population <18 Years Living Below Federal Poverty Level,Michigan 2008-2010 All-State=21.8% 2008-10 American Community Survey, U.S. Census Bureau
Percent of Population <5 Years Living Below Federal Poverty Level,Michigan 2008-2010 All-State=26.0% 2008-10 American Community Survey, U.S. Census Bureau
Percent of Civilian Labor Force that is Unemployed,Michigan 2008-2010 All-State=8.1% 2008-10 American Community Survey, U.S. Census Bureau
Percent of Population 3 years and Older Enrolled in Nursery/Preschool,Michigan 2008-2010 All-State=5.5% 2008-10 American Community Survey, U.S. Census Bureau
Percent of Population >25 Years with Less than a High School Diploma,Michigan 2008-2010 All-State=11.6% 2008-10 American Community Survey, U.S. Census Bureau
Percent of Population >25 Years with Less than a Bachelor’s Degree,Michigan 2008-2010 All-State=75.0% 2008-10 American Community Survey, U.S. Census Bureau
Percent of Renters Paying >30% of Income on Rent,Michigan 2008-2010 All-State=55.1% 2008-10 American Community Survey, U.S. Census Bureau
Percent of Population Speaking English Less than “Very Well”,Michigan 2008-2010 All-State=3.2% 2008-10 American Community Survey, U.S. Census Bureau
Percent Not Living in Owner-Occupied Housing,Michigan 2008-2010 All-State=26.6% 2008-10 American Community Survey, U.S. Census Bureau
Percent Households With No Vehicle Available for Use,Michigan 2008-2010 All-State=7.5% 2008-10 American Community Survey, U.S. Census Bureau
Percent Living in Different House than Last Year,Michigan 2008-2010 All-State=14.8% 2008-10 American Community Survey, U.S. Census Bureau
Self-Reported Health Status is Fair or Poor,Michigan 2008-2010 All-State=14.1% 2008-10 Michigan Behavioral Risk Factor Survey, MDCH
Percent with ≥14 Unhealthy Physical Days in Past Month,Michigan 2008-2010 All-State=10.4% 2008-10 Michigan Behavioral Risk Factor Survey, MDCH
Percent with ≥14 Unhealthy Mental Days in Past Month,Michigan 2008-2010 All-State=10.9% 2008-10 Michigan Behavioral Risk Factor Survey, MDCH
Percent with Dissatisfied or Very Dissatisfied with Life,Michigan 2008-2010 All-State=6.4% 2008-10 Michigan Behavioral Risk Factor Survey, MDCH
Overweight Prevalence,Michigan 2008-2010 All-State=35.0% 2008-10 Michigan Behavioral Risk Factor Survey, MDCH
Obesity Prevalence,Michigan 2008-2010 All-State=30.7% 2008-10 Michigan Behavioral Risk Factor Survey, MDCH
Percent with No Leisure Time Physical Activity,Michigan 2008-2010 All-State=23.9% 2008-10 Michigan Behavioral Risk Factor Survey, MDCH
Percent with Inadequate Fruit and Vegetable Consumption,Michigan 2008-2010 All-State=78.4% 2007-09 Michigan Behavioral Risk Factor Survey, MDCH
Prevalence of Current Smoking,Michigan 2008-2010 All-State=20.1% 2008-10 Michigan Behavioral Risk Factor Survey, MDCH
Prevalence of Heavy Drinking,Michigan 2008-2010 All-State=5.4% 2008-10 Michigan Behavioral Risk Factor Survey, MDCH
Prevalence of Binge Drinking,Michigan 2008-2010 All-State=17.3% 2008-10 Michigan Behavioral Risk Factor Survey, MDCH
Percent without Health Insurance,Michigan 2008-2010 All-State=11.7% 2008-10 American Community Survey, U.S. Census Bureau
Percent Who Did Not Receive Health Care in the Past Year When Needed To, Due to Cost,Michigan 2008-2010 All-State=13.7% 2008-10 Michigan Behavioral Risk Factor Survey, MDCH
Percent Who Have Not Had a Routine Checkup in the Past Year,Michigan 2008-2010 All-State=33.3% 2008-10 Michigan Behavioral Risk Factor Survey, MDCH
Percent With No Usual Source of Healthcare,Michigan 2008-2010 All-State=13.2% 2008-10 Michigan Behavioral Risk Factor Survey, MDCH
Gonorrhea Incidence, Michigan 2012 Number of new cases per 100,000 people. All-State=129.2 2012 HIV/STD/VH/TB Epidemiology Section, MDCH
HIV Prevalence, Michigan 2012 Number of cases per 100,000 people. All-State=159.0 2012 Epidemiologic Profile of HIV in Michigan, MDCH
All-Cause Mortality Rate (per 100,000)Michigan 2006-2010 All-State=798.9 2006-2010 Michigan Resident Death Files, MDCH
Heart Disease Mortality Rate (per 100,000)Michigan 2006-2010 All-State=209.7 2006-2010 Michigan Resident Death Files, MDCH
Asthma Prevalence Among Adults,Michigan 2008-2010 All-State=10.1% 2008-10 Michigan Behavioral Risk Factor Survey, MDCH
Stroke Mortality Rate (per 100,000)Michigan 2006-2010 All-State=40.4 2006-2010 Michigan Resident Death Files, MDCH
Diabetes Prevalence Among Adults,Michigan 2008-2010 All-State=8.8% 2008-10 Michigan Behavioral Risk Factor Survey, MDCH
Diabetes Mortality Rate (per 100,000)Michigan 2006-2010 All-State=24.4 2006-2010 Michigan Resident Death Files, MDCH
All-Cancer Incidence (per 100,000)Michigan 2008-2010 All-State=480.6 2008-10 Michigan Resident Cancer Incidence File, MDCH
All-Cancer Mortality Rate (per 100,000)Michigan 2006-2010 All-State=182.6 2006-2010 Michigan Resident Death Files, MDCH
Chronic Liver Disease Mortality Rate (per 100,000)Michigan 2006-2010 All-State=9.5 2006-2010 Michigan Resident Death Files, MDCH