Download
1 / 20
200 likes | 362 Views
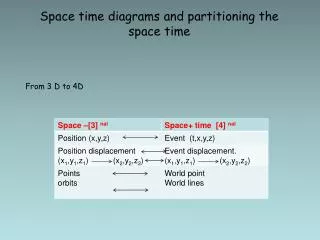
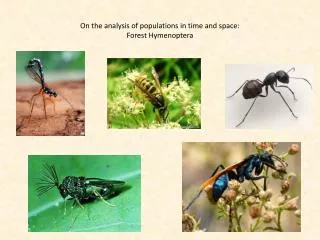
On the analysis of populations in time and space: Forest Hymenoptera. A fresh beech forest in spring. and later in the year. Basic population parameters: Species densities (m -2 ). Basic population parameters: Species richness and densities.

E N D
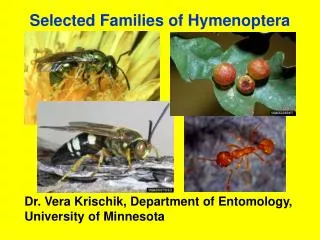
On the analysis of populations in time and space: Forest Hymenoptera
A fresh beech forest in spring and later in the year
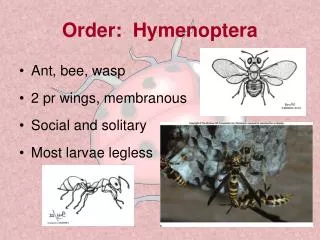
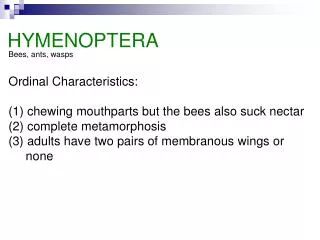
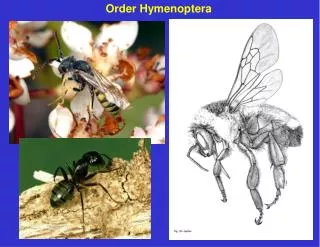
Basic population parameters: Species richness and densities Hymenoptera is the most species rich taxon in temperate terrestrial ecological systems.
The question of coexistence Population versus communityecology
The magnitude of population fluctuations in forest Hymenoptera N(1982)/N(1981) We calculate population increase and decrease R from the observed species abundances.
The net reproductive rate N(1982)/N(1981) Średnia() The values are too precise The net rate of population growth was independent of average density. Most species increased in density. The net rate of population growth increased with variability in density. Is this correct?
Średnia.geometriczna() Średnia.geometriczna() R was independent of average density and density fluctuations. Net reproductive rates scattered equally around the equilibrium value of R = 1.
The effective maximum net rate of population growth The theoretical upper boundary of R denotes the average number of eggs layed by each female. >1 High maximum reproductive rates were linked to high absolute fluctuations according to Taylor’s power law.
Maximum Hymenoptera reproduction rates were not significantly linked to averge species densities Maximum Hymenoptera reproduction rates increased with the observed variability in density. The probability of this relation was P(H1) > 0.95. (Significance of the regression is P(H0) < 0.05) Species with larger fluctuations in abundance had higher capacities for recruitment.
Densityregulation If a populationisregulted in a density dependent manner the correlationbetweenDNt and Ntshould be negative. N K Time
Density regulation Are populations really density dependent regulated? N )>> K )>> Time In random walk time series we expect negative correlations of DN and N. Bulmer’s (1975) test for density dependence At least 20 generations are needed to detect density dependence Trichogramma embryophagum Only one of the 26 parasitoid species passed the test.
The variance - mean ration in the form of the Lloyd index J >> 1: chaotic density fluctuations J = 1: Poisson random fluctuations <J << 1: densities at equilibrium Variability in population size of forest Hymenoptera was positively linked to geometric mean density. Nearly all Lloyd values are far above 1.0. Populations are not regulated. Are populations in equilibrium?
The band model of density dependence N Density dependence Nmax Density independence Random walk K Nmin Density dependence t Most species fluctuate randomly with certain upper and lower boundaries of population density At lower density, the Allee effect might cause a positive density dependence, that means populations have even less ability for recruitment. Factors that cause density independence: Factors that cause density dependence: • unpredictable weather conditions • unstable habitats • high degrees of dispersal • predator – prey cycles • cyclic weather conditions (el Nino, el Nina, NAO) • density dependent mortality and reproduction
Intrinsic rates of increase Outbreak species Phygadeuon ursini Parasitoid of Cheilosia fasciata on Allium ursinum
Population outbreaks Circles mark years of zero abundance. Four of 26 abundant Hymenopteran species increased abundances duig two years by a factor of more than 1000. After the outbreak populations collapsed
On the probability of extinction In the case of random walks extinction probabilities are given by Annual extinction probability