Download
1 / 43
430 likes | 559 Views
Planning for growth, dealing with slow-down 2008 GMFM forecasts. Neil Gibson Director of Regional Services: Oxford Economics 20 th November 2008 . Overview. The City Region economy Exposure to the slow-down Longer term prospects Drilling down – the district prospects

E N D
Planning for growth, dealing with slow-down2008 GMFM forecasts Neil Gibson Director of Regional Services: Oxford Economics 20th November 2008
Overview • The City Region economy • Exposure to the slow-down • Longer term prospects • Drilling down – the district prospects • Risks and strategic questions • Summary
Set in context • Just over 3.2 million people live in the City Region district (47% of the region and 5% of the UK) • 1,66 million jobs are located in the City Region (49% of the region and 5% of the UK) • An estimated £5.5bn of GVA is produced in the City Region (51% of the region and 5% of the UK) • The region has grown by 139,200 jobs over the last decade • Population has grown by 73,800 over the last decade
A largely urban structure Note: Other includes agriculture, extraction, utilities, financial services and public admin
A remarkable decade for jobs Total Employment, 1981=100
A more recent upturn in population Population, 1981=100
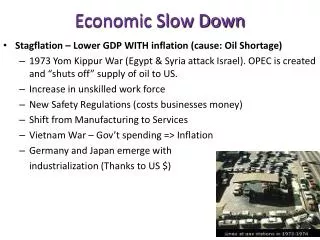
City Region exposure The problems of consumer confidence, borrowing restraints and lower demand for exports will all have an impact
Recession for 2009 Employment and GVA growth, City Region, 2000 - 2010
A wide sectoral reach Job loss during the slow down in the City Region and the North West, 2008-2010
Summarising the impacts With UK contracting at -0.9% in 2009 and 1% in 2010, City Region impacts: • 45,000 jobs lost • GVA falling negative in 2009 • 3.2 percentage point fall in city region employment rate • Unemployment to rise to 82,000 people • Average house prices to fall 11.8%
Growth returning post 2010 Employment growth, 1981-2018 (1981=100)
City Region – continued move to ‘office jobs’ Employment %, City Region, 98, 08, 18
GVA growth – positive by 2010 GVA growth (%), City Region, 2000 - 10
The crucial role of migration – North West North West migration, 1991 - 2025
Natural increase also key… Natural increase, North West, 1992 - 2026
Greater Manchester migration Greater Manchester migration, 1991 - 2025
Natural increase much larger in Greater Manchester Greater Manchester natural increase, 1992 - 2026
Employment rates to fall back in short term Employment rates in City Region, North West and UK, 1994-2018
Continued industrial importance for some Manufacturing employment, % of total, 2008
Service sector export base – concentrated in city Transport & comms, finance & business services employment, % of total, 2008
Manchester – professional services centre Total employment and employment in financial & business services, 1981-2018
Forecasts raise many issues • What will be the impact on housing (increased renting? a ‘squeeze’ in pick-up phase?) • What will skills needs be? (pool of unemployment workers, migrant flows – where will they go?, people put off service sector choices?) • What about transportation plans? (employment struggling back to 2008 levels) • Land needs – what impact a service sector slow down (falling rent costs?) • Environmental aspects (off the agenda? Forgone in interests of growth and cost?) • Impact on targets and performance metrics Note GMFM has (or will have) something to say empirically on each of these points
Probabilities of different outcomes Slowdown Longer term
Strategy during the downturn • Holding nerve to long term aims key • Whilst looking to aid employers where possible • Banks landlords and creditors need to be sympathetic • Chance to rebalance the staff books (including recruitment) • Public sector needs to be sensitive to costs (e.g. speed of planning applications, grant release and cost cutting internally) • Good return on public investment (regen, house building etc – as costs cheaper) • Advertising and marketing makes a greater impact during costs sensitive times • Recessions ‘focus the mind’ necessity forces brave decisions and culls inefficient firms • Use up past resources (if they exist!)
Planning for better • A base case forecast is built around three factors: • The macro economic conditions (sectoral and regionally) • The past performance of an area (no change in the relative impact of policy / supply factors is built in) • The relationships between economic factors (the fundamentals) e.g. wages and spending, total employment and employment in supporting services • It does not set out the economic outcomes that an area may wish to see delivered (indeed a main purpose to highlight potential under-performance to allow policy development) • Building aspirational scenarios look to set out the desirable outcomes, perhaps through variation of supply side factors (skills, land, infrastructure) or success in performance of existing firms / attracting new firms
Where might opportunities lie? • Financial and professional services still offer long term growth prospects (exporting to the growing world – activities squeezed out of London) • Perhaps activities allied to health and education may offer opportunities hard to replace world class expertise) • Environmental sciences will ultimately be important • The tourist offering also potential • How to harness the spending power of the aging population • Still a lot of regen design, construction and delivery to carry out (image matters for location decisions) • Remember for the UK – ultimately – it is the export base that matters – a major conurbation and concentration of skills has clearly a role to play
Tougher times – uncertainty rising • Tougher times (particularly in late 08 and 09) • The real ‘impact’ being felt now • Aggressive action is being taken – but impact unknown (in new territory) • Impact of slowdown on migration key – but unclear • Greater volatility in outlooks (a lower outlook is possible) • Recovery into 2010 projected – but uncertainties remain • The UK and London must ultimately remain the world financial and advanced professional services centre • Someone / something must spend and create demand (consumer, business or government) • Plan for a return to growth – but strategy needs plans B and C not just plan A.
Contact info:Neil GibsonDirector of Regional Services, Oxford Economics0844 979235607803 728994ngibson@oxfordeconomics.com