Variations in ESI-MS Spectra of MUP Isoforms in Urine Samples
Analyzing intact mass spectra of MUP isoforms in urine samples from male & female B6 and BALB/c mice, with individual spectra displayed and common mass peaks indicated.

Variations in ESI-MS Spectra of MUP Isoforms in Urine Samples
E N D
Presentation Transcript
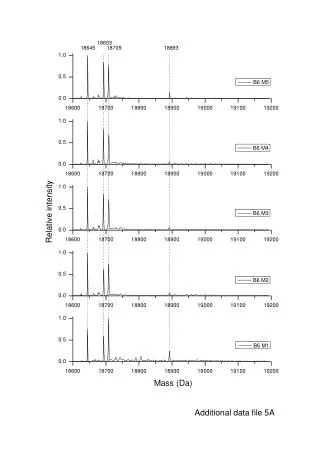
18693 18645 18709 18893 Additional data file 5A
18693 18645 18709 18893 5B
18693 18645 18709 18893 5C
18693 18645 18709 18893 5D
18693 18645 18709 18893 5E Additional data file 5. Individual variation in ESI-MS mass spectra of MUP isoforms in urine. Urine samples from multiple individuals from each strain/sex were analysed by intact mass spectrometry, and the individual spectra are displayed from 18600 Da to 19190 Da. Dotted lines locate the commonly observed mass corresponding to specific proteins. (A) male B6 (n = 5); (B) female B6 (n = 8); (C) male BALB/c (n = 6); (D) female BALB/c (n = 7); (E) male (n = 2) and female (n = 2) 129S5. The spectra are scaled to the base peak intensity (the highest peak in the whole mass spectrum = 1).