
Uploaded by
abby
1 SLIDES
119 VIEWS
10LIKES
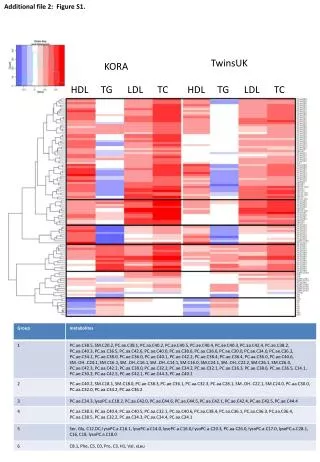
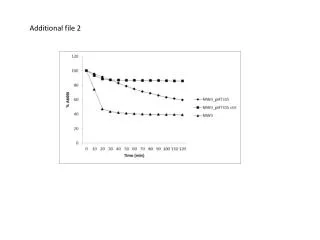
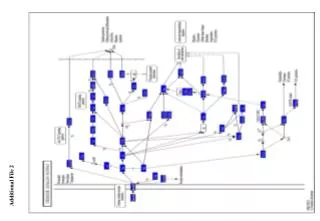
Xenoarray Analysis of Library-Transduced MDCK Cells Pre- and Post-Replicate Selection in Infection
DESCRIPTION
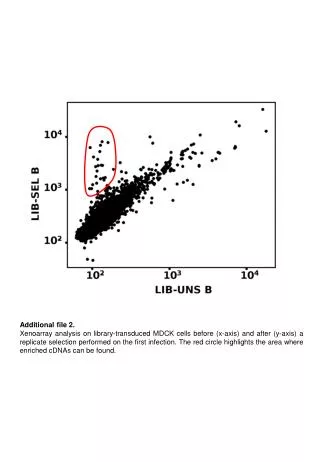
Explore the Xenoarray analysis on MDCK cells before and after a replicate selection process during the initial infection. The visualization highlights the region where enriched cDNAs are detected, aiding in understanding gene expression changes post-infection.
Download
1 / 1
Download Presentation 
Xenoarray Analysis of Library-Transduced MDCK Cells Pre- and Post-Replicate Selection in Infection
An Image/Link below is provided (as is) to download presentation
Download Policy: Content on the Website is provided to you AS IS for your information and personal use and may not be sold / licensed / shared on other websites without getting consent from its author.
Content is provided to you AS IS for your information and personal use only.
Download presentation by click this link.
While downloading, if for some reason you are not able to download a presentation, the publisher may have deleted the file from their server.
During download, if you can't get a presentation, the file might be deleted by the publisher.
E N D
Presentation Transcript
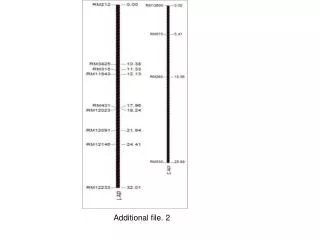
Additional file 2. Xenoarray analysis on library-transduced MDCK cells before (x-axis) and after (y-axis) a replicate selection performed on the first infection. The red circle highlights the area where enriched cDNAs can be found.


More Related
Audio
Live Player