CHAPTER 10: Introducing Probability
CHAPTER 10: Introducing Probability. ESSENTIAL STATISTICS Second Edition David S. Moore, William I. Notz, and Michael A. Fligner Lecture Presentation. Chapter 10 Concepts. The Idea of Probability , Chance Behavior Probability Models Probability Rules

CHAPTER 10: Introducing Probability
E N D
Presentation Transcript
CHAPTER 10:Introducing Probability ESSENTIAL STATISTICS Second Edition David S. Moore, William I. Notz, and Michael A. Fligner Lecture Presentation
Chapter 10 Concepts The Idea of Probability,ChanceBehavior Probability Models Probability Rules Finite and Discrete Probability Models Continuous Probability Models
What is Probability? • The chance an event will occur • P(event) = The number of favorable outcomes / The total number of possible outcomes • Event example: flipping coin landing on head • P(H) = # of possibilities landing on head / # of all possibilities P(H) = ½ = 50 %
Chance Behavior ■Probability is the science of chance behavior ■Chance behavior is unpredictable in the short run but has a regular and predictable pattern in the long run ■this is why we can use probability to gain useful results from random samples and randomized comparative experiments
The Idea of Probability Chance behavior is unpredictable in the short run, but has a regular and predictable pattern in the long run. We call a phenomenon randomif individual outcomes are uncertain but howeverthere is a regular distributionof outcomes in a large number of repetitions. Probability: P(event) = The number of favorable outcomes / The total number of possible outcomes
Probability Models Descriptions of chance behavior contain two parts: • a list of possible outcomes • a probability for each outcome The sample space Sof a chance process is the set of all possible outcomes. An eventis an outcome or a set of outcomes of a random phenomenon. That is, an event is a subset of the sample space. A probability modelis a description of some chance process that consists of two parts: ◙ a sample space S ◙ a probability for each outcome.
Probability Models Example: Give a probability model for the chance process of rolling two fair, six-sided dice―one that’s red and one that’s green. Sample Space 36 Outcomes Since the dice are fair, each outcome is equally likely. Each outcome has probability 1/36.
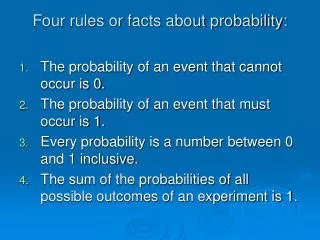
Probability Rules Any probability is a number between 0 and 1. All possible outcomes together must have probability 1. If two events have no outcomes in common, the probability that one or the other occurs is the sum of their individual probabilities. The probability that an event does not occur is 1 minus the probability that the event does occur. Rule 1. The probability P(A) of any event A satisfies 0 ≤ P(A) ≤ 1. Rule 2. If S is the sample space in a probability model, then P(S) = 1. Rule 3. If A and B are disjoint, P(A or B) = P(A) + P(B). This is the addition rule for disjoint events. Rule 4.For any event A, P(Adoes not occur) = 1 – P(A).
Probability Rules Distance-learning courses are rapidly gaining popularity among college students. Randomly select an undergraduate student who is taking distance-learning courses for credit and record the student’s age. Here is the probability model: • Show that this is a legitimate probability model. • Find the probability that the chosen student is not in the traditional college age group (18 to 23 years). Each probability is between 0 and 1 and 0.57 + 0.17 + 0.14 + 0.12 = 1 P(not 18 to 23 years) = 1 – P(18 to 23 years) = 1 – 0.57 = 0.43
Finite and Discrete Probability Models One way to assign probabilities to events is to assign a probability to every individual outcome, then add these probabilities to find the probability of any event. This idea works well when there are only a finite (fixed and limited) number of outcomes. A probability model with a finite sample space is called finite. To assign probabilities in a finite model, list the probabilities of all the individual outcomes. These probabilities must be numbers between 0 and 1 that add to exactly 1. The probability of any event is the sum of the probabilities of the outcomes making up the event.
Continuous Probability Models Suppose we want to choose a number at random between 0 and 1, allowing any number between 0 and 1 as the outcome. We cannot assign probabilities to each individual value because there is an infinite interval of possible values. • Cannot assign a probability to each individual outcome (because there are an infinite number of outcomes) • A continuous probability model: probabilities are assigned to intervals of outcomes by using areas under density curves Exampleconvert observed values of the endpoints of the interval to standardized scores (z scores), then find probabilities from Table A.
Normal Probability Models Often the density curve used to assign probabilities to intervals of outcomes is the Normal curve. • Normal distributions are probability models: • Probabilities can be assigned to intervals of outcomes using the Standard Normal probabilities in Table A. • The technique for finding such probabilities is found in Chapter 3.
Random Variables ◊ A numerical variable that describes the outcomes of a chance process is called a random variable. ◊ The probability model for a random variable is its probability distribution. A random variabletakes numerical values that describe the outcomes of some chance process. The probability distributionof a random variable X gives its possible values and their probabilities. Example:Consider tossing a fair coin 3 times. Define X= the number of heads obtained X = 0: TTT X = 1: HTT THT TTH X = 2: HHT HTH THH X = 3: HHH
Discrete Random Variable There are two main types of random variables: discrete and continuous. If we can find a way to list all possible outcomes for a random variable and assign probabilities to each one, we have a discrete random variable. • A discrete random variableXtakes a fixed set of possible values with gaps between. The probability distribution of a discrete random variable Xlists the values xiand their probabilities pi: • Value:x1x2x3 … • Probability:p1p2p3 … • The probabilities pi must satisfy two requirements: • Every probability piis a number between 0 and 1. • The sum of the probabilities is 1. • To find the probability of any event, add the probabilities piof the particular values xithat make up the event.
Continuous Random Variable Discrete random variables commonly arise from situations that involve counting something. Situations that involve measuring something often result in a continuous random variable. A continuous random variableY takes on all values in an interval of numbers. The probability distribution of Y is described by a density curve. The probability model of a discrete random variable X assigns a probability between 0 and 1 to each possible value of X. A continuous random variable Y has infinitely many possible values. All continuous probability models assign probability 0 to every individual outcome. Only intervals of values have positive probability.
Chapter 10 Objectives Review Describe the idea of probability Describe chance behavior with a probability model Apply basic rules of probability Describe finite and discrete probability models Describe continuous probability models Define random variables