Probability Distribution in Binomial Models
Learn about creating probability distributions in binomial models to analyze the likelihood of specific outcomes in a set number of trials. Understand how to calculate probabilities for different scenarios, such as the number of defective computer chips in a sample or the number of wins in a game. Discover the use of binomial notation, probability mass function, and cumulative distribution function to solve problems efficiently. Explore examples and calculations for practical applications like archery accuracy and survey responses.


Probability Distribution in Binomial Models
E N D
Presentation Transcript
Example: Computer chips have a 25% chance of being defective. Create the probability distribution for X, if X is the # of defective chips in a sample of 3.
Example: Computer chips have a 25% chance of being defective. Create the probability distribution for X, if X is the # of defective chips in a sample of 3. (a)What is the probability of having 2 or more defective chips? (a)What is the probability of having 1 or less defective chips? (a)What is the probability of having exactly 2 defective chips?
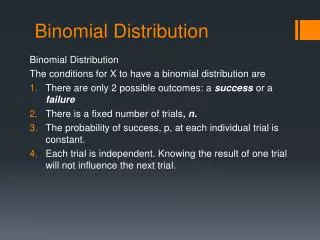
BINOMIAL MODELS: Interested in the number of successes in a set number of trials 4 conditions that must apply: o Only 2 possible outcomes (success/failure) o Probability of success remains constant (called p) o Number of trials is set/known (called n) o Independent trials 10% Condition: If we cannot assume independence, we can proceed as long as the sample is smaller than 10% of the population If these 4 conditions apply, we have a Binomial model
Notation: B(n, p) µX= σX=
Example: It is known that only 15% of the population is left-handed. Create a probability distribution for the number of left handed people in a sample of 3.
Quicker way to get probabilities: Formula: P(X = k) = *same example as above*
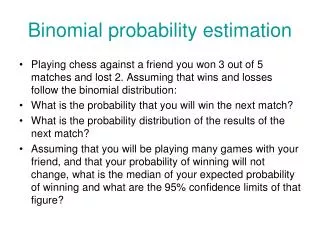
Example: I am playing a game in which I have a 39% chance of winning each time I play. Create the probability distribution for the number of wins out of 5 plays of the game. STEP 1: Check if the problem is binomial
STEP 2: Create the probability distribution STEP 3: answer questions P(X=2) = P(X < 2) = P(X ≥ 3) = P(2 ≤ X ≤ 4) =
Would you want to answer these questions for a sample size of 50? Of 100? NO! So we can use the calculator! For P(X = k) Use k = pdf =
For P(X ≤ k) Use k = Notice that is ONLY GIVES YOU: _________________ cdf =
Example: John is taking archery. He has a 30% chance of hitting the target each time he shoots. He shoots 8 times 1) What is the probability that he hits the target 4 times? 2) What is the probability that he hits the target 2 times or less? 3) What is the probability that he hits the target at least 3 times? 4) What is the probability that he hits the target less than 5 times? 5) What is the probability that he hits the target more than 6 times? 6) How many times do we expect him to hit the target? (average!) 7) What is the standard deviation of the number of times he hits the target?
Try this example on your own: 150 businesses are sent mailings asking them to answer a survey question and send the mailing back. The probability of nonresponse is 55%. 1) What is the average number of businesses that WILL respond? 2) What is the standard deviation of the number of businesses that WILL respond? 3) What is the probability that 75 businesses will respond? 4) What is the probability that 60 businesses or less will respond? 5) What is the probability that 60 businesses or more will respond? 6) What is the probability that less than 60 businesses will respond? 7) What is the probability that greater than 60 businesses will respond? 8) What number of surveys would you have to send out if you wanted to be able to expect to get 90 back? 9) What is the probability that between 50 and 70 businesses will respond?
B(150, 0.45) 1) mX= 67.5 businesses 2) sX= 6.093 businesses 3) P(X = 75) = 0.0306 4) P(X < 60) = 0.1251 5) P(X > 60) = 1-P(X < 59) = 0.9058 6) P(X < 60) = P(X < 59) = 0.0942 7) P(X > 60) = 1-P(X < 60) = 0.8749
8) mX= n*p 90 = (n)(0.45) n = 200 9) P(50 < X < 70) = P(51 < X < 69) = P(X < 69) - P(X < 50) = 0.6271
COMPLETE THE EXPERIMENT
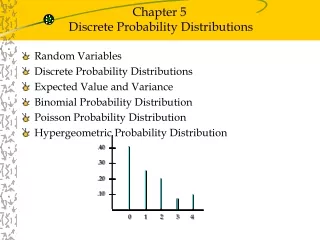
Ch. 17: Probability Models: Binomial Random Variables: LARGE SAMPLE SIZE What happens to the shape of the Binomial Random Variable when n is large? What is considered a “large enough” n (for the shape to look normal)??
So if the check passes… •We can say that the distribution is ___________________, and can use ___________________! •Calculator: normalcdf(lower bound, upper bound, mean, std. dev) •Same mean and std dev. that we learned before: m np X s (1 ) np p X
Example 1: It is said that 75% of people pay their credit card bill on time. If we take a sample of 125 adults, what is the chance that over 80 of them paid their bill on time this past month?
Example 2: Assume 15% of adults jog regularly. We survey 1,000 adults what is the probability that between 120 and 160 people in our sample jogs?