
Graphing Motion
E N D
Presentation Transcript
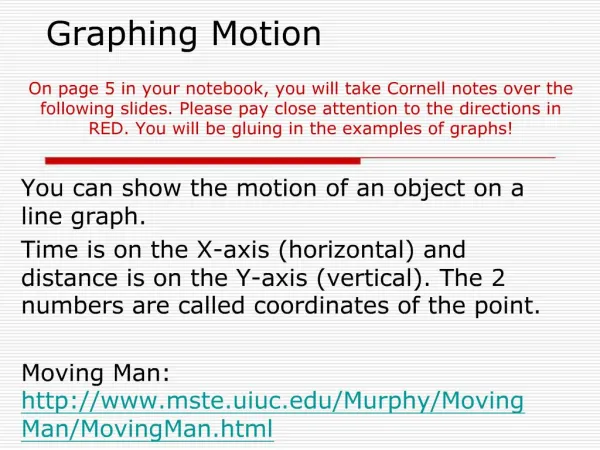
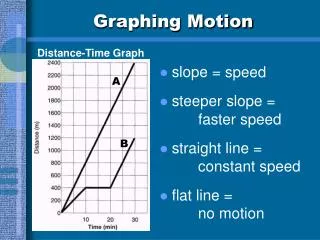
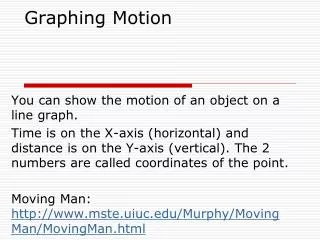
DISTANCE-TIME GRAPHSPlotting distance against time can tell you a lot about motion. Let's look at the axes:
Time is always plotted on the X-axis(bottom of the graph). The further to the right on the axis, the longer the time from the start.Distance is plotted on the Y-axis (side of the graph). The higher up the graph, the further from the start.
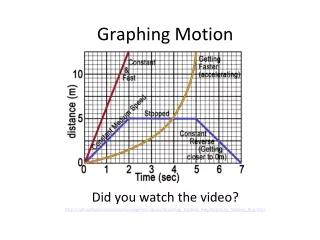
If an object is not moving, a horizontal line is shown on a distance-time graph. Time is increasing to the right, but its distance does not change. It is not moving. We say it is At Rest.
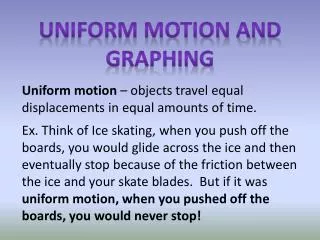
If an object is moving at a constant speed, it means it has the same increase indistance in a given time: Time is increasing to the right, and distance is increasing constantly with time. The object moves at a constant speed. Constant speed is shown by straight lines on a graph.
Let’s look at two moving objects:Both of the lines in the graph show that each object moved the same distance, but thesteeper dashed line got there before the other one: A steeper line indicates a larger distance moved in a given time. In other words, higher speed. Both lines are straight, so both speeds are constant.
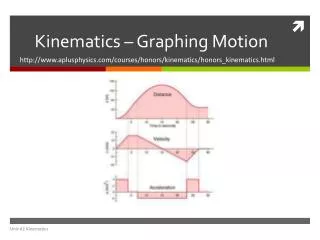
Graphs that show acceleration look different from those that show constant speed.Time is increasing to the right, and distance The line on this graph is curving upwards. This shows an increase in speed, since the line is getting steeper: In other words, in a given time, the distance the object moves is change (getting larger). It is accelerating.
Summary: A distance-time graph tells us how far an object has moved with time. •The steeper the graph, the faster the motion. •A horizontal line means the object is not changing its position - it is not moving, it is at rest. •A downward sloping line means the object is returning to the start.
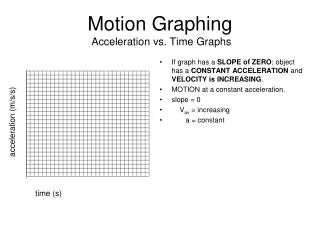
SPEED-TIME GRAPHSSpeed-Time graphs are also called Velocity Time graphs.Speed-Time graphs look much like Distance-Time graphs. Be sure to read the labels!! Time is plotted on the X-axis. Speed or velocity is plotted on the Y-axis.A straight horizontal line on a speed-time graph means that speed is constant. It is not changing over time. A straight line does not mean that the object is not moving!
This graph shows increasing speed.The moving object is accelerating.
This graph shows decreasing speed.The moving object is decelerating.
What about comparing two moving objects at the same time? Both the dashed and solid line show increasing speed. Both lines reach the same top speed, but the solid one takes longer. The dashed line shows a greater acceleration.
Summary:A speed - time graph shows us how the speed of a moving object changes with time.•The steeper the graph, the greater the acceleration.•A horizontal line means the object is moving at a constant speed.•A downward sloping line means the object is slowing down.
Distance/time graph Speed(velocity)/time graph