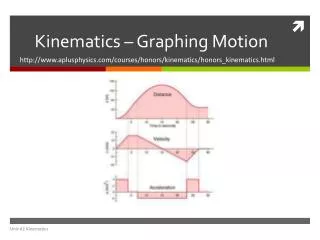
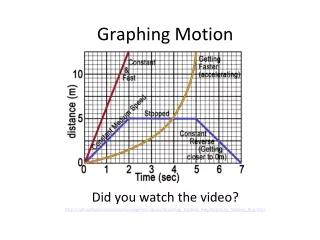
Graphing Motion
This resource explores the fundamental concepts behind position-time and speed-time graphs, focusing on how they illustrate changes in an object's position or speed over time. Learn how to create and interpret these graphs, with hands-on examples including estimating an object's position at a specific moment and calculating the slope to determine average speed. Discover the relationship between slope, speed, and motion, and understand how graph shape reflects constant versus changing speeds. Ideal for students and educators in physics and mathematics.

Graphing Motion
E N D
Presentation Transcript
Graphs • Graphs can show how objects change position or speed. (How far away was the turtle after 60 seconds?)
Position-Time Graphs • Graphs often show how something changes with time. • This graph shows how temperature changes with time in Santa Barbara, California.
Making a Position-Time Graph • This table shows how far a turtle has moved after an amount of time.
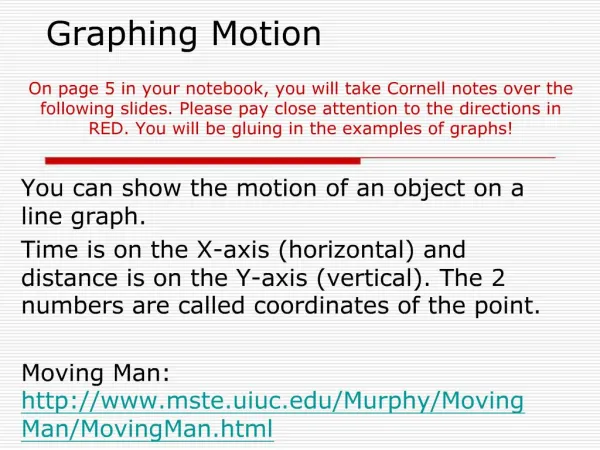
Making a Position-Time Graph (cont.) • Plotting the time on the x-axis and plotting the distance the turtle has moved on the y-axis creates the graph. • You can draw a line through the points and use it to estimate the turtle’s position at a given time. (Estimate the position of the turtle at 90 seconds)
Units on Position-Time Graphs • Each number has units associated with it. • Position has units of length like cm, m, or km. • Seconds, minutes, and days are units of time.
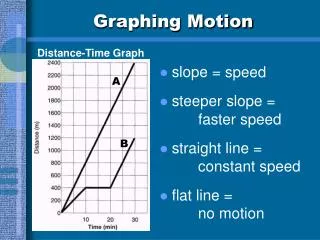
Slope of a Position-Time Graph • The steepness of a line on a graph is called the slope. • The steeper the slope, the faster the object is traveling. (Which line represents a faster moving turtle?) • On a position-time graph, a steeper line means a greater average speed.
Calculating Slope from a Position-Time Graph • To find the slope of a line, the origin and another point are used to calculate the rise and the run.
rise run slope = Calculating Slope from a Position-Time Graph(cont.) • Rise is the change in vertical direction (up and down). • Run is the change in horizontal direction (left to right).
Slope and Average Speed • Average speed is the total distance divided by the total time taken to travel that distance. • Rise is equal to the distance traveled. • Run is equal to the time taken to travel that distance. • Average speed is equal to the slope of the line on a position-time graph.
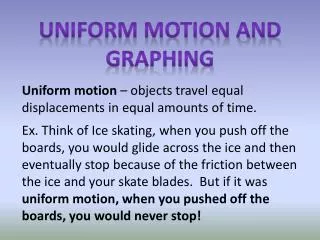
Position-Time Graphs for Changing Speed • Only objects with a constant speed will have position-time graphs with a straight line.
Position-Time Graphs for Changing Speed(cont.) • To find the average speed of the entire trip, use the starting and ending points.
Position-Time Graphs for Changing Speed(cont.) • Then calculate the slope of the line that would connect those points. (Calculate the slope using (0,0) and (10,10))
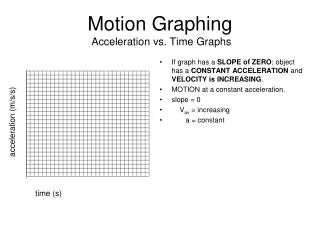
Speed-Time Graphs • Graphing instantaneous speed of an object shows how the speed of an object changes with time. • Constant speed on a speed-time graph is a horizontal line because the speed does not change.
Speed-Time Graphs (cont.) • If an object speeds up, the plotted line slants up towards the right.
Speed-Time Graphs (cont.) • If an object slows down, the plotted line slants down towards the right.
Lesson 1-3: Review The horizontal change on a graph is also called the ____. A rise B elevation C run D distance
Lesson 1-3: Review The steepness of a line on a graph is called the ____. A slope B hill C rise D run
Lesson 1-3: Review If the rise is equal to 75 m and the run is equal to 2.5 m, then what is the slope? A 187.5 m B 12 m C 30 m D 0.03 cm