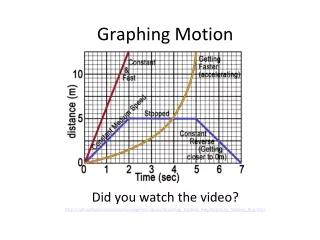
Understanding Graphs of Motion
200 likes | 297 Views
Learn about displacement and velocity vs. time graphs, interpret motion of objects, find acceleration, and calculate total displacement using areas under curves. Important concepts and examples included.

Understanding Graphs of Motion
E N D
Presentation Transcript
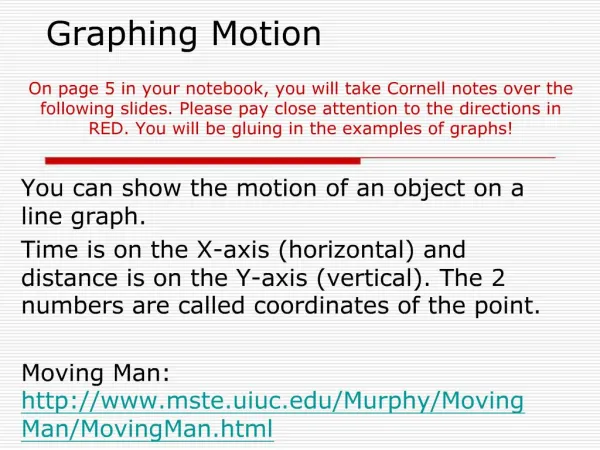
Displacement vs. time Describe the motion of the object represented by this graph This object is at rest 2m from the reference point. Displacement (m) time(s)
Displacement vs. time Describe the motion of the object represented by this graph Starting at the origin, the object travels at a constant velocity of +2.0 m/s for 3.0 s and ends +6.0 m from the origin. Displacement (m) time(s)
Displacement vs. time Describe the motion of the object represented by this graph Starting 5.0 m from the origin, the object travels at a constant velocity of -1.25 m/s for 4.0 s and ends at the origin. Displacement (m) time(s)
Displacement vs. time Describe the motion of the object represented by this graph Starting -3.0m from the origin, the object travels at a constant velocity of +4.0 m/s for 1.0 s then stops and rest at +1.0m for 2.0 s then travels with a constant velocity of -2.0 m/s for 2.0 s and ends at -3.0m from the origin. Displacement (m) time(s)
Displacement vs. time Describe the motion of the object represented by this graph Starting +2.0m from the origin, the object travels with an unknown positive velocity but a negative acceleration for 3.0s and comes to a stop +4.0m from the origin Displacement (m) time(s)
Displacement vs. time Describe the motion of the object represented by this graph Negative velocity positive acceleration Displacement (m) time(s)
Displacement vs. time Describe the motion of the object represented by this graph Negative velocity negative acceleration Displacement (m) time(s)
Displacement vs. time Describe the motion of the object represented by this graph Positive velocity negative acceleration Displacement (m) time(s)
Displacement vs. time Describe the motion of the object represented by this graph Positive velocity positive acceleration Displacement (m) time(s)
Velocity vs. time Describe the motion of the object represented by this graph This object is traveling at a constant velocity of +2.0m/s Velocity (m/s) time(s)
Velocity vs. time Describe the motion of the object represented by this graph Starting from rest, the object accelerates constantly with an acceleration of +2.0 m/s 2for 3.0 s and ends with a velocity of +6.0 m/s. Velocity (m/s) time(s)
Velocity vs. time Describe the motion of the object represented by this graph Starting with a velocity of +5.0 m/s , the object has a constant acceleration of -1.25 m/s2 for 4.0 s and ends at rest. Velocity (m/s) time(s)
Velocity vs. time Describe the motion of the object represented by this graph Starting with a velocity of -3.0 m/s, the object accelerates constantly at a rate of +1.0m/s2 for 3 seconds. At this point the object is instantaneously at rest while changing direction and then continues on its acceleration for 3.0 more seconds and ending with a final velocity of +3.0m/s. Velocity(m/s) time(s)
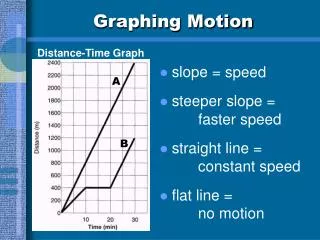
D/t vs. V/t graphs • What information can we get from a d/t graph? • Starting position • Final position • Velocity • Direction of motion • Whether or not acceleration is positive or negative, but not the numerical value.
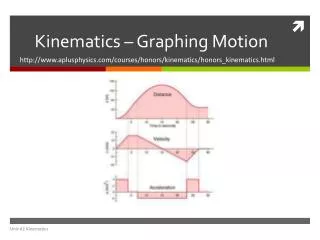
D/t vs. V/t graphs • What information can we get from a v/t graph? • Starting velocity • Final velocity • Instantaneous velocity • Direction of motion • Acceleration (numerical value) • Total displacement
How do we get displacement from a v/t graph? • By finding the area “under” the graph. The area of the first part is -4.5.0m The area of the second part is +4.5.0m Velocity(m/s) time(s) Total area is … (so total displacement is) 0.0 m
Things to remember • Straight line constant slope • Curved line changing slope • On a d/t graph, slope is the velocity • On a v/t graph, slope is the acceleration • Total displacement on a v/t graph is found by calculating the area “under” the line • On a graph with a curve, the slope at a given point is found by drawing a tangent line and finding its slope.
d/t -straight line is constant velocity -horizontal line is constant 0 velocity -curved line is acceleration -slope of line is velocity v/t -horizontal line is constant velocity -straight line is constant acceleration -slope of line is acceleration -displacement is found by reading the area between the line & the x-axis