Download
1 / 11
110 likes | 241 Views
This project introduces students to data collection and representation through interactive lessons. In the first lesson, students complete a simple survey about their preferences, learn about graphs via instructional videos, and engage in reflective activities on a Padlet wall. Subsequent lessons focus on analyzing bar graphs, line plots, and practical data collection activities, culminating in a final project where students gather data, create graphs, and present findings. The curriculum aims to build foundational skills in understanding and creating various data representations.

E N D
ECMP 355 Final Project Introduction to Data Collection & Representation
Lesson 1 - Introduction In the first lesson the students do a variety of activities to get themselves acquainted with data collection and representation. Their first task is to fill out a survey I created with Google Forms. The survey is a simple an “about you/favourites” questionnaire that introduces them to data collection. The data results appear in future lessons to create a sense of relatedness. Their next activity involves watching a video tailored to their age level. The video explains the process of collecting data and how to create a graph from the data. The students are next directed to post a comment on a Padlet wall answering the question, “tell me about a graph you have seen before today”. The lesson also asks them to view the wall that all assignments will be submitted to.
Lesson 2 – Analyzing Bar Graphs Lesson two focuses on the analyses of bar graphs. The students are instructed to look through a website that explains bar graphs. At the end of the site is a practice link. The drop down menu offers the answer to questions. The third task for the students is to watch a video from Youtube that has an explanation of how to make and use a bar graph. Throughout the lesson, the students are given multiple ways to learn about the graphs.
Lesson 3 – Analyzing Line Plots This lesson focuses on line plots. The goal of this lesson is to gain exposure to line plots, learn the different aspects of the graphs, know the labels, and how to create them. Their first activity is to watch a video I created on Pixiclip, demonstrating how to make a line plot. There is a link to further information under the next task. Their third activity is to play an interactive game. It is a fun way of collecting data in order to create the plots. There is a link to a game and a link to the correlating worksheet. The closing exercise is to write one sentence about a bar graph or a line plot on an interactive wall. As the students have been taking in so much information about the two graphs in only a few days, I felt that the wall is a good way of reflecting on what they have learned.
Lesson 4 – Making Line Plots from a Pictograph In lesson 4 the students are instructed to take the information from pictographs provided, copy a sheet off of Google Docs and create 3 line plots. I provided a pictograph and line plot as an example. The new learning in this exercise is that line plots don’t always have to have number labels; they can be names or preferences, for example. They also get to practice their new knowledge.
Lesson 5 – What Does the Data Say? So far in the unit, students have learned about data, graphs, and how to create them. The learning goal of this lesson is to understand and practice how to read them. The students start with three warm up activities, then fill out a worksheet, and finally conclude with a Padlet post about how everything is going in the unit. This is a good place for a checkpoint as we just past half way and they have a final project to begin shortly.
Lesson 6 – Data Results & Graphing This lesson is about collecting data and graphing the results. The students are to work through a few warm up activities. Once they have completed this, they find a partner and flip a coin 10 times each and record the results. There is a chart for them to complete showing the results of heads or tails for each partner. They also have a template and a webpage posted for them to graph the results on a line plot and a bar graph. The lesson can be done individually if necessary. The student would do all the same work, just with one less column in the results.
Lesson 7 – Is the Data Valid? In this last lesson before the final project, the students are given two charts of mock results and their correlating bar graphs. There are mistakes in both of the scenarios and they are to find the mistakes and record them.
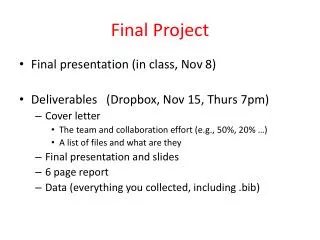
UNIT FINAL PROJECT Instead of a unit exam, the students are to complete a final project. The details of the project are comprehensive and involve most of the learnings thus far. The project is submitted on a PowerPoint. The students think of a question that holds significance in their lives. They poll approximately 40 people and record the results. Next, they create a graph of the results. Finally they write in sentence form what the results say. They complete the assignment with any extra information they want to share or pictures, etc. Once all of the projects are complete, students will take turns in groups of approximately 4, presenting their PowerPoints to one another.
Introduction to Data Collection & Representation Lesson 1 – https://drive.google.com/file/d/0B9iyeXo4u65Ub29xOEpaS3hVYVk/edit?usp=sharing Lesson 2 – https://drive.google.com/file/d/0B9iyeXo4u65UMTFfbmh6VVAxVDg/edit?usp=sharing Lesson 3 – https://drive.google.com/file/d/0B9iyeXo4u65UQmNMdGh2dEJhelU/edit?usp=sharing Lesson 4 – https://drive.google.com/file/d/0B9iyeXo4u65UbHJCWEQtbjFzVTg/edit?usp=sharing Lesson 5 – https://drive.google.com/file/d/0B9iyeXo4u65UTi1YcXlicUpCdFU/edit?usp=sharing Lesson 6 – https://drive.google.com/file/d/0B9iyeXo4u65UTk8wcDRXNUZORXc/edit?usp=sharing Lesson 7 – https://drive.google.com/file/d/0B9iyeXo4u65UVENiNVI5QnlFMEE/edit?usp=sharing Unit Final Project – https://drive.google.com/file/d/0B9iyeXo4u65UZV9PS3hUTmVzNkk/edit?usp=sharing Unit Plan - https://drive.google.com/file/d/0B9iyeXo4u65UUTZIQ0ZLR1pTS1U/edit?usp=sharing