Download

1 / 11
110 likes | 240 Views
Population growth curves illustrate how populations increase and stabilize over time. They are determined by the balance of births and immigration against deaths and emigration. The concept of carrying capacity represents the maximum population that an environment can sustain. Examples, like placing different numbers of fish in tanks, show how populations can equalize despite initial differences due to reproduction and mortality rates. Additionally, reproductive potential highlights the ability of organisms to reproduce under optimal conditions, significantly impacting population dynamics.

E N D
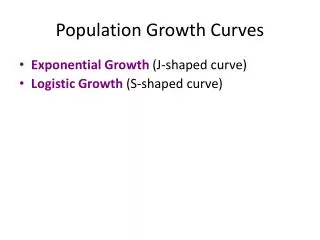
Population growth curves • Population is measured as: • Births + immigration = deaths + emigration
Population growth curves • Population is measured as: • Births + immigration = deaths + emigration • The number of a population present at any one time is a balance between its reproductive potential and the environmental resistance.
Population growth curves • Population is measured as: • Births + immigration = deaths + emigration • The number of a population present at any one time is a balance between its reproductive potential and the environmental resistance. • For a given species, this is called the carrying capacity
Population growth curves • Population is measured as: • Births + immigration = deaths + emigration • The number of a population present at any one time is a balance between its reproductive potential and the environmental resistance. • For a given species, this is called the carrying capacity • Eg = In one tank place two fish, in another place 25 fish. After a certain amount of time, both tanks will have the same amount of fish – why?
Population growth curves • Population is measured as: • Births + immigration = deaths + emigration • The number of a population present at any one time is a balance between its reproductive potential and the environmental resistance. • For a given species, this is called the carrying capacity • Eg = In one tank place two fish, in another place 25 fish. After a certain amount of time, both tanks will have the same amount of fish – why? • Because one will have fish die, the other will breed
Reproductive potential • Maximum ability of organisms to reproduce themselves under optimum conditions
Reproductive potential • Maximum ability of organisms to reproduce themselves under optimum conditions • The reproductive potential of all animals is extremely high
Reproductive potential • Maximum ability of organisms to reproduce themselves under optimum conditions • The reproductive potential of all animals is extremely high • Eg = Darwin predicted a single pair of elephants could leave over 19 million descendants in only 750 years! (If they all survived)
Reproductive potential • Maximum ability of organisms to reproduce themselves under optimum conditions • The reproductive potential of all animals is extremely high • Eg = Darwin predicted a single pair of elephants could leave over 19 million descendants in only 750 years! (If they all survived) • Open population – one where the organisms can immigrate and emigrate (come in and leave). Why would they leave?
Reproductive potential • Maximum ability of organisms to reproduce themselves under optimum conditions • The reproductive potential of all animals is extremely high • Eg = Darwin predicted a single pair of elephants could leave over 19 million descendants in only 750 years! (If they all survived) • Open population – one where the organisms can immigrate and emigrate (come in and leave). Why would they leave? • Closed population – one where organisms can’t move out. Eg - ?