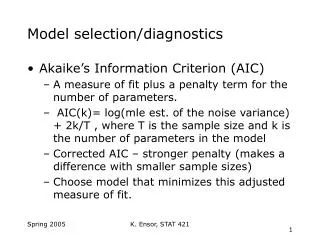
Combinatorially Complex Equilibrium Model Selection
Discover the process of selecting models in complex equilibria. Learn how to generate and choose the best models using Akaike Information Criterion (AIC). Explore the implementation of model selection in system biology and protein interaction studies.


Combinatorially Complex Equilibrium Model Selection
E N D
Presentation Transcript
Combinatorially Complex Equilibrium Model Selection Tom Radivoyevitch Assistant Professor Epidemiology and Biostatistics Case Western Reserve University Email: txr24@case.edu Website: http://epbi-radivot.cwru.edu/
Combinatorially Complex Equilibrium Model Selection(overview/title breakdown) • Combinatorially Complex Equilibria: • few reactants => many possible complexes • Generate the possible models + Select or average the best • Selection/Averaging: Akaike Information Criterion (AIC) • AIC decreases with P and then increases • Billions of models, but only thousands near AIC upturn • Challenge: Generate 1P, 2P, 3P model space chunks sequentially • 8GB RAM => max of ~5000 models at a time • Models = Hypotheses • Spurs: complete K = ∞ [Complex]=0 • Grids: binary K equal each other • R package ccems (CRAN) implements the methods
Center Relevance • Structures constrain minimal simplicity and maximal complexity of possible complexes and models in the model space • Move prior knowledge of structures into enzyme models • System Biology models integrate enzyme models • Protein-Protein Protein-Ligand Interaction readouts: • Enzyme activities and DLS mass (i.e. average measures) • Mass distributions of complexes (e.g. SEC and GEMMA) • Validate omic-predicted interactions and model them • PEPCC (Harry Gill): Systematically express, purify and characterize interaction suspects (e.g. of core wnt signaling proteins)
Ultimate Goal • Better understanding => better control • Conceptual models help trial designs today • Computer models of airplanes help train pilots and autopilots Future Present • Safer flying airplanes with autopilots • Ultimate Goal: individualized, state feedback based clinical trials Radivoyevitch et al. (2006) BMC Cancer 6:104
DNA polymerase TK1 dNTP Supply System flux activation inhibition nucleus ADP dATP dA GDP dGTP DNA dCK dG dCTP CDP dCK dCK RNR ATP or dATP mitochondria dC dTTP UDP DCTD cytosol cytosol 5NT TS dA dAMP dATP dUMP dUDP dGK dT dG dGMP dGTP dU dUTP dUTPase dC dN dCMP dCTP TK2 dT dTMP dTTP NT2 dN Figure 1.dNTP supply. Many anticancer agents act on or through this system to kill cells. The most central enzyme of this system is RNR.
Ribonucleotide Reductase (RNR) R1 R1 R1 R1 R1 R1 R1 R1 R1 R1 R1 R1 ATP activates at hexamerization site?? dATP inhibits at activity site, ATP activates at activity site? R1 R1 R2 R2 R2 R2 R1 ATP, dATP, dTTP, dGTP bind to selectivity site UDP, CDP, GDP, ADP bind to catalytic site R1 R1 R2 R2 • 5 catalytic site states x 5 s-site states x 3 a-site states x 2 h-site states = 150 states • (150)6 different hexamer complexes => 2^(150)6 models ~ 1 followed by a trillion zeros RNR is Combinatorially Complex
Michaelis-Menten Model E + S ES RNR: no NDP and no R2 dimer => kcat of complex is zero, else different R1-R2-NDP complexes can have different kcat values.
Michaelis-Menten Model [S] vs. [ST] Substitute this in here to get a quadratic in [S] which solves as Bigger systems of higher polynomials cannot be solved algebraically => use ODEs (above) (3) R=R1 r=R22 G=GDP t=dTTP solid line = Eqs. (1-2) dotted = Eq. (3) Data from Scott, C. P., Kashlan, O. B., Lear, J. D., and Cooperman, B. S. (2001) Biochemistry40(6), 1651-166
Enzyme, Substrate and Inhibitor E ES EI ESI E ES EI ESI E ES EI ESI Competitive inhibition E EI ESI E EI ESI E ES EI noncompetitive inhibition Example of K=K’ Model = E | ES EI | ESI = = uncompetitive inhibition if kcat_ESI=0 E ES ESI E ES ESI = E EI E ESI E ES E
Rt Spur Graph Models for dTTP induced R1 dimerization (RR, Rt, RRt, RRtt) JJJJ JJIJ JJJI JIJJ IJJJ R R RR R RR R RR R RR R = R1 t = dTTP Rt RRt Rt Rt RRt RRt Rt RRt RRtt RRtt RRtt RRtt JIIJ JIJI IIJJ IJIJ IJJI JJII R RR R RR R R R RR R RRt Rt RRt RRt Rt Rt RRtt RRtt RRtt III0 IIII II0I 0III I0II JIII IJII IIIJ IIJI R RR R R R R R RR R R R Rt RRt Rt RRt RRtt RRtt Total number of spur graph models is 16+4=20 Radivoyevitch, (2008) BMC Systems Biology 2:15
Rt Grid Graph Models KR_R Kd_R_R RR t t R R t t RR t t R R t t | | | | ? | | KR_t Kd_RR_t = Kd_R_t = | | KRt_R = Kd_Rt_R RRt t Rt R t RRt t Rt R t | | | | ? KR_t Kd_RRt_t Kd_R_t = | | = KRt_Rt Kd_Rt_Rt | | Rt Rt RRtt | Rt Rt RRtt | HDDD HDFF RR t t R R t t = = = = = KR_R = = = KRR_t = KR_t = RRt t Rt R t HIFF = = = = = = KRRt_t = = = RRtt
Application to Data Scott, C. P., Kashlan, O. B., Lear, J. D., and Cooperman, B. S. (2001) Biochemistry40(6), 1651-166 R III0m IIIJ RRtt HDFF = = AICc = N*log(SSE/N)+2P+2P(P+1)/(N-P-1) Radivoyevitch, (2008) BMC Systems Biology 2:15
ATP-induced R1 Hexamerization 2+5+9+13 = 28 parameters => 228=2.5x10⁸ spur graph models via Kj=∞ hypotheses 28 models with 1 parameter, 428 models with 2, 3278 models with 3, 20475 with 4 R = R1 X = ATP Kashlan et al. Biochemistry 2002 41:462 Yeast R1 structure. Dealwis Lab, PNAS 102, 4022-4027, 2006
-- = -- = = = = -- = = X = -- X = = = = X -- = = = -- = = = = = = = = = = = = = X -- X -- -- X -- = -- -- = = = = = = = -- -- = -- -- -- = = = = = -- = -- = = -- -- = -- = -- -- -- -- -- = = = = -- -- -- -- -- = = = -- -- = -- = X X = -- = = -- = = -- = X X = -- = -- -- = = = -- = -- = -- -- = -- = = = X X = -- = = -- -- = = = -- X -- -- -- = = -- -- -- = = = X -- X X X X = X -- -- = = = = = = X = = = -- = X X -- -- -- = = = -- -- = = = X -- X = -- = = = -- -- = = = = X -- -- -- -- = = = -- -- -- -- = = = -- = -- = = = = = X -- = = X = = = = = = = = X = = X = = = = = = = = = = = = = = = = = = = = = = = = = = = = = = = = = = = =
2088 Models with SSE < 2 min (SSE) Data from Kashlan et al. Biochemistry 2002 41:462 Kolmogorov-Smirnov Test p < 10-16 28 of top 30 did not include an h-site term; 28/30 ≠ 503/2081 with p < 10-16 This suggests no h-site. Top 13 included R6X8 or R6X9, save one, single edge model R6X7 This suggests that less than 3 a-sites are occupied in hexamer.
DNA polymerase TK1 Conclusions (so far) • The dataset does not support the existence of an h-site • The dataset suggests that ~1/2 of the a-site are not occupied by ATP R1 R1 R1 R1 R1 R1 flux activation inhibition nucleus ADP dATP dA GDP dGTP DNA dCK dG dCK dCK dCTP CDP RNR ATP or dATP mitochondria dC a dTTP UDP DCTD a a cytosol a cytosol 5NT TS dA dAMP dATP dUMP dUDP a a dGK dT dG dGMP dGTP dU dUTP dUTPase dC dN dCMP dCTP TK2 dT dTMP dTTP NT2 dN [ATP]=~1000[dATP] So system prefers to have 3 a-sites empty and ready for dATP Inhibition versus activation is partly due to differences in pockets
Tetrameric Enzyme Models (e.g. Thymidine Kinase 1) X 8 K Models x 8 k Models => 64 Models If [S] ≈ [ST]
K = (0.85, 0.69, 0.65, 0.51) µM k = (3.3, 3.9, 4.1, 4.1) sec-1 DFFF.DDDD DDLL.DDDD DDDM.DDDD DDDD.DFFF DDDD.DDLL DDDD.DDDM kmax = 4.1/sec S50 = 0.6 µM h = 1.1
K = (10-6, 10-3, 1, 103) • k = (100, 10, 40, 10) B)k = (10, 10, 40, 100) • With parameters initially at ½ their true values, A identified itself, B had difficulties (its 1st two K estimates were off 2-5-fold). • Horizontal lines are k1/4, 2k2/4, 3k3/4 and 4k4/4 • Vertical lines are K1/4, 2K2/3, 3K3/2 and 4K4
SUMMARY Combinatorially Complex Equilibrium Model Selection (ccems, CRAN 2009) Systems Biology Markup Language interface to R (SBMLR, BIOC 2004) R1 R1 R1 R1 R1 R1 R1 R1 R1 R1 R1 R1 Model individual enzymes Model networks of enzymes R2 R2 R2 R2 R1 R1 R1 R1 R1 R2 R2
Background: Quake Lab Microfluidics Figure 9. J. Melin and S. R. Quake Annu. Rev. Biophys. Biomol. Struct. 2007. 36:213–31 Figure 8. T. Thorsen et al. (S. R. Quake Lab) Science 2002 Figure 9 shows how a peristaltic pump is implemented by three valves that cycle through the control codes 101, 100, 110, 010, 011, 001, where 0 and 1 represent open and closed valves; note that the 0 in this sequence is forced to the right as the sequence progresses.
Adaptive Experimental Designs Find best next 10 measurement conditions given models of data collected. Need automated analyses in feedback loop of automatic controls of microfluidic chips
5 10 0 Simple example of a control system for a single-input single-output (SISO) system Kp + setpoint water temperature hot plate ∫ Σ Ki -
Why Systems Biology Model components: (Deterministic = signal) + (Stochastic = noise) Engineering Statistics Emphasis is on the stochastic component of the model. Is there something in the black box or are the input wires disconnected from the output wires such that only thermal noise is being measured? Do we have enough data? Emphasis is on the deterministic component of the model We already know what is in the box, since we built it. The goal is to understand it well enough to be able to control it. Predict the best multi-agent drug dose time course schedules Increasing amounts of data/knowledge
MMR- Cancer Treatment Strategy Damage Driven or S-phase Driven IUdR dNTP demand is either Salvage dNTPs + Analogs DNA + Drug-DNA De novo DNA repair
Conclusions • For systems biology to succeed: • move biological research toward systems which are best understood • specialize modelers to become experts in biological literatures (SB is not a service)
Acknowledgements • Case Comprehensive Cancer Center • NIH (K25 CA104791) • Chris Dealwis (CWRU Pharmacology) • Anders Hofer (Umea) • Thank you
Indirect Approach pro-B Cell Childhood ALL • T: TEL-AML1 with HR • t : TEL-AML1 with CCR • t : other outcome • B: BCR-ABL with CCR • b: BCR-ABL with HR • b: censored, missing, or other outcome Ross et al: Blood 2003, 102:2951-2959 Yeoh et al: Cancer Cell 2002, 1:133-143 Radivoyevitch et al., BMC Cancer 6, 104 (2006)
NADP+ NADPH DHFR Hcys Met 10 MTR THF 4 7 DHF FAICAR 5 6 HCOOH FDS 12 ATIC 11 ATP ATIC 2R 2 FTS Ser CHODHF ADP HCHO SHMT AICAR Gly 13 CH3THF FGAR GART 1R 1 GAR NADP+ NADPH NADP+ NADPH MTHFD CHOTHF MTHFR 8 3 9 CH2THF TS dUMP dTMP Morrison PF, Allegra CJ: Folate cycle kinetics in human breast cancer cells. JBiolChem 1989, 264:10552-10566.
library(ccems) # Thymidine Kinase Example topology = list( heads=c("E1S0"), # E1S0 = substrate free E sites=list( c=list( # c for catalytic site t=c("E1S1","E1S2","E1S3","E1S4") ) # t for tetramer ) ) # TK1 is 25kDa = 25mg/umole, so 1 mg = .04 umoles g = mkg(topology, activity=T,TCC=F) dd=subset(TK1,(year==2000),select=c(E,S,v)) dd=transform(dd, ET=ET/4,v=ET*v/(.04*60))# now uM/sec tops=ems(dd,g,maxTotalPs=8,kIC=10,topN=96)#9 min on 1 cpu library(ccems) # Ribonucleotide Reductase Example topology <- list( heads=c("R1X0","R2X2","R4X4","R6X6"), sites=list( # s-sites are already filled only in (j>1)-mers a=list( #a-site thread m=c("R1X1"), # monomer 1 d=c("R2X3","R2X4"), # dimer 2 t=c("R4X5","R4X6","R4X7","R4X8"), # tetramer 3 h=c("R6X7","R6X8","R6X9","R6X10", "R6X11", "R6X12") # hexamer 4 ), # tails of a-site threads are heads of h-site threads h=list( # h-site m=c("R1X2"), # monomer 5 d=c("R2X5", "R2X6"), # dimer 6 t=c("R4X9", "R4X10","R4X11", "R4X12"), # tetramer 7 h=c("R6X13", "R6X14", "R6X15","R6X16", "R6X17", "R6X18")# hexamer 8 ) ) ) g=mkg(topology,TCC=TRUE) dd=subset(RNR,(year==2002)&(fg==1)&(X>0),select=c(R,X,m,year)) cpusPerHost=c("localhost" = 4,"compute-0-0"=4,"compute-0-1"=4,"compute-0-2"=4) top10=ems(dd,g,cpusPerHost=cpusPerHost, maxTotalPs=3, ptype="SOCK",KIC=100) K = e∆G/RT => K = (0, ∞) maps to ∆G = (-∞, ∞) Model weights e∆AIC/∑e∆AIC
Bias in 1st four residuals => Do not weight errors Conjecture Greater X/R ratio dominates at high Ligand concentrations In this limit the system wants to partition As much ATP into a bound form as possible