Download
1 / 14
140 likes | 254 Views
In this lesson, students will learn how to draw a picture graph to represent data sets visually. By activating prior knowledge, students will solve problems using a picture graph, focusing on categories, titles, and data values. They will practice determining questions, relevant information, and interpreting data, enhancing their understanding of mathematical concepts. Students will independently practice creating picture graphs based on collected data, discussing relevance, and learning the process of drawing and analyzing these graphs to organize information effectively.

E N D
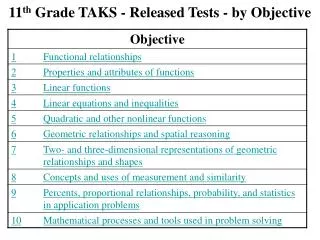
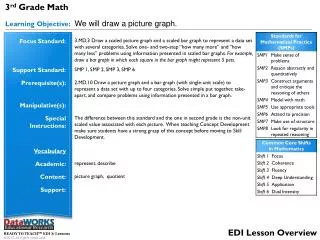
3rd Grade Math Learning Objective:We will draw a picture graph.
Learning Objective We will draw a picture graph. What are we going to do? CFU Activate Prior Knowledge Use the picture graph to solve the problems below. • 1. How many students had hot lunch? • 2. How many students had cold lunch? 4 Students, you know that we can use picture graphs to solve problems. Now, we will draw a picture graph. Make Connection 3
Concept Development A picture graph represents1 a data setusing pictures. • The title describes2 the data set represented in the picture graph. • Categories are groups that data was collected for. • Data are the number values collected. • The key tells the value the picture represents. CFU Which is the title of the picture graph above? How do you know? A Apple B Student’s Favorite Juice Write down one category of the picture graph. How do you know what you wrote is a category? How many students chose orange juice as their favorite? How do you know? A 2 B 4 C 8 Data Set Picture Graph = 5 students = 2 students 1 shows 2 tells about Vocabulary
Skill Development/Guided Practice A picture graph represents a data set using pictures. How did I/you write in each category? How did I/you draw the pictures in each category? CFU Draw a picture graph. 2 Read the data set carefully. Write in each category. Draw the pictures in each category. Divide the value in each category by the value of the picture. The quotient3 is the number of pictures that go in the category. 1 3 2 3 a b Days of Rain Each Month January 4 pictures February 6 pictures March 5 pictures 3 pictures April = 2 days of rain 3 answer to a division problem Vocabulary
Skill Development/Guided Practice (continued) How did I/you determine what the question is asking? How did I/you determine the math concept required? How did I/you determine the relevant information? How did I/you solve and interpret the problem? How did I/you check the reasonableness of the answer? CFU 1 2 3 Use the picture graph to answer the questions. 4 1. How many students chose football? _____________________________________ _____________________________________ 16 students chose football 5 Students’ Favorite Sport soccer 2. How many students chose basketball? _____________________________________ _____________________________________ 20 students chose basketball baseball basketball 3. Which sport do students like the most? _____________________________________ _____________________________________ The students like basketball the most. football = 4 students 4. Which sport do the students like the least? _____________________________________ _____________________________________ The students like soccer the least.
Relevance A picture graph represents a data set using pictures. Drawing a picture graph will help you organize collected information. 1 Mr. Jefferson collected information on people’s favorite meal. He used his data set to draw a picture graph to organize the information. = 10 students Drawing a picture graph will help you do well on tests. 2 Does anyone else have another reason why it is relevant to draw a picture graph? (Pair-Share) Why is it relevant to draw a picture graph? You may give me one of my reasons or one of your own. Which reason is more relevant to you? Why? CFU Sample Test Question: What does a key tell about the picture graph? A the number of pictures in the picture graph B the title of the data set C the groups data was collected for D the number value of each picture
A picture graph represents a data set using pictures. Skill Closure Draw a picture graph. Read the data set carefully. Write in each category. Draw the pictures in each category. Divide the value in each category by the value of the picture. The quotient is the number of pictures that go in the category. 1 2 3 a Favorite Subject b Reading Word Bank 3 pictures picture graph represent data set quotient Math 2 pictures 4 pictures Science = 20 students Where Students Use the Computer Access Common Core Jill collected information to see where studentsused the computer. She created a picture graph from her data set. She did not put the right number of pictures in the School category. What can she do to fix it? Home School Library = 5 students Summary Closure What did you learn today about drawing a picture graph? (Pair-Share) Use words from the word bank.
Independent Practice A picture graph represents a data set using pictures. Draw a picture graph. Read the data set carefully. Write in each category. Draw the pictures in each category. Divide the value in each category by the value of the picture. The quotient is the number of pictures that go in the category. 1 2 3 a Favorite Field Trip b Zoo 4 = 5 pictures 4 = 6 pictures Aquarium 4 = 3 pictures Museum 4 = 4 pictures Theater = 4 votes
Independent Practice (continued) Use the picture graph to answer the questions. 1. How many erasers are there? _____________________________________ _____________________________________ There are 12 erasers. School Supplies pencils 2. How many pencils are there? _____________________________________ _____________________________________ There are 18 pencils. glues erasers 3. Which school supply has the most? _____________________________________ _____________________________________ Markers are the most. markers = 6 items 4. Which school supply has the least? _____________________________________ _____________________________________ Erasers are the least.
Periodic Review 1 Favorite Movie Alice in Wonderland Iron Man 2 5 = 4 Toy Story 3 5 = 7 5 = 5 Despicable Me 5 = 2 = 5 people Access Common Core Molly drew five pictures in the graph above to show the number of people who went to see Alice in Wonderland. Explain why Molly is incorrect. ________________________________________________________________________________________________________________________________________________________________________________________________________________________________________________________________________ Each picture represents 5 people. If there are 5 pictures then that represents 25 people. That is not correct since only 20 people chose Alice in Wonderland as their favorite movie.
Periodic Review 2 Favorite Vacation Apple Theme Park Granola Bar 10 = 3 Orange Slices Camping 10 = 5 Raisins 10 = 4 Beach = 10 students 10 = 2 A Access Common Core C B = 4 people Which data set (A, B, or C) matches the picture graph above? How do you know?
Periodic Review 3 Favorite Sports Soccer Basketball 4 = 6 4 = 3 Tennis 4 = 4 Swimming 4 = 5 = 4 people Access Common Core Culminating Activity: Take a vote of students’ favorite shapes with a show of hands. Teacher counts hands and students use the table to record the data. Based on the data set, teacher must create a suitable key for the picture graph (round number values in data set up or down, if necessary). Teacher writes in the key of the picture graph. Students write in the categories and draw the correct number of pictures for each category.
EDI – Cognitive, Teaching, and English Learner Strategies Cognitive Strategies Teaching Strategies Language Strategies Content Access Strategies