Download
1 / 14
140 likes | 274 Views
APEX floats from Webb Research represent over 50% of global ocean profiling floats, yet many are equipped with Seabird pressure sensors that experience drift over time, impacting Argo data used for calculating ocean heat content. Current correction methods rely on flawed surface pressure data, leading to potential inaccuracies. This research identifies the need for improved correction techniques for approximately 800 affected floats, while also addressing temperature effects on pressure measurements. Enhancements in data accessibility and DAC responsiveness are proposed to ensure data accuracy and reliability.

E N D
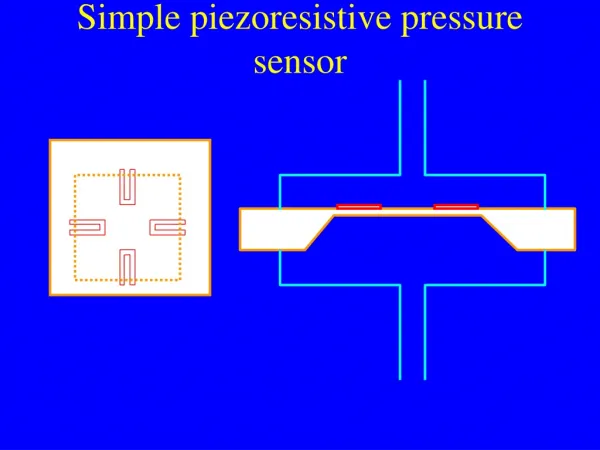
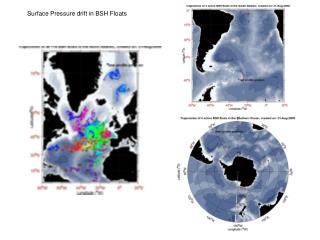
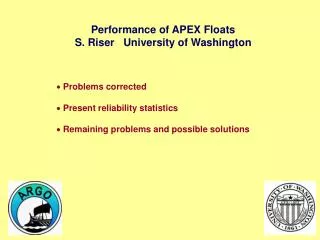
Background • Apex floats from Webb Research currently account for over 50% of the total number of floats deployed. • Many of these floats are equipped with Seabird pressure sensors which drifted over time, usually within 20 dbar, but in extreme cases it has been as high as 150 dbar. • This error is significant when Argo data is used to calculate ocean heat content. • The current correction method is to subtract the surface pressure from the pressure field. • The surface pressure is a single sample of the surface pressure recorded by the float prior to submerging, as such it is significantly effected by waves, wind, etc. Quite often the historical record is incomplete. • “The surface pressure measurement … was a flight-control parameter and never intended to be used as scientific data” [Swift, Personal communications] • The majority of the Apex floats do not report negative surface pressures. In the following slides: • Data presented is mixture of R and D mode but with QC of 1
Calculating Surface Pressure A lot of noise can be introduced by simply interpolating between raw surface pressure values. To minimise the errors in the surface pressure record, an equation is fitted to the surface pressure, which then allows calculation of surface pressure at a given time.
Negative drifting pressure sensors • Quite often this data passes though all QC, but it really should be flagged so a user can decide if they want to include it in their project. • A method for correcting these floats needs to be developed, about 800 floats. The extreme case, float flagged A negative drifting float, these values have not been flagged
Temperature effects Pressure sensors. • As the float rises through the water column it experiences increases in temperatures, these changes are the largest at the thermocline. If this thermocline is strong and quite shallow the effect is still felt at the ocean surface. • This effect can be as large as 1 dbar, in the tropics, which is small, but small correctable errors should be eliminated as the overall effect can be significant. • Effect not limited to APEX pressure sensors. {Seen in Ninja}.
A couple of problems, that were identified at Coriolis In theory this should have been simple. At present how the surface pressure values are applied, and the actual name of the surface pressure in the .tech files is related to each DAC, this will change in future. However, at present IF is releasing some surface pressures with the standard 5 dbar offset and others without it. The profile netcdf data files do not have the 5 dbar offsets applied to the adjusted pressure fields when it is has been removed from the surface pressures. IF float without 5 db offset IF float with 5 db offset The CoriolisGDAC site is missing data that is on the US GDAC. As a user who relies predominantly on the Coriolis GDAC, due to a fasterconnection, this was a hurdle.
As shown the raw and calculated values were similar but their application differs Note. In this figure,Barker 2007, is an earlier version of the Argo data than that shown though this presentation When the Surface Pressure is applied uniformly then there is similarity
Not all data was rejected due to it failing the Paul&Jeff quality control test, a significant quantity passes our QC but fails due to negative drifting pressure sensors Blue – data that fails our QC. Green - data that passes our QC, but is recorded by negative drifting float.Red – Data that passes our QC, recorded by correctable pressure sensor.
Comparison of upper ocean heat content before and after drift correction This figure is coming, hopefully it will be completed prior to this talk. If I do not crash the computer, yet again. We expect changes of this magnitude to have impact in the calculation of ocean heat content and thermal heat expansion.
What I would like to see change • When errors are discovered, I found it quite difficult to contact DAC’s, contacting the Float PI’s is either very slow or none responsive, there are exceptions to this. • Need an easy way to contact the DAC who is responsible for each float, this may be listed somewhere but I could not find it. Possibly adding this to the location/information map on jcommops web site. • Peer pressure by the AST and a time limit is needed to have the DAC’s modify their tech files to the new format.