Download
1 / 14
150 likes | 257 Views
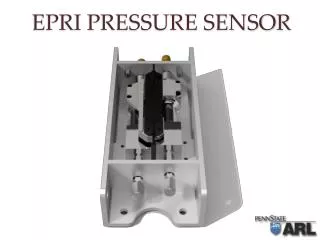
This document outlines the calibration process of differential pressure sensors using tension and compression vessels. The pressure in a single vessel was incrementally increased from 0 to approximately 1200 psi, while the other vessel remained at 0 psi. Pressure and strain data were collected, allowing for the calculation of vessel sensitivities based on the strain-to-pressure relationship. The comparison of measured strain data against the pressure transducer readings shows excellent correlation, ultimately enhancing the accuracy of the differential pressure calibration.

E N D
To calibrate the system, the pressure in a single vessel was increased in increments every 3-5 minutes from 0 to ~1200 psi as the other vessel was held at 0 psi. The pressure in each vessel was recorded with a pressure transducer so that the difference in total pressure can be calculated.
While the pressure was increased, the change in the strain wavelength was recorded and converted to a temperature corrected strain
The measured and converted temperature corrected straincan now be related to the measured pressure
The slope of the linear fit line can be converted to the vessel sensitivity by … 1 micro-strain / slope of the linear fit line. The plot below is the data measured from the Tension vessel calibration
The Compression vessel calibration behaved similar to the Tension vessel calibration … but a different sensitivity resulted from a different slope.
The Tension vessel and Compression vessel are very similar but small differences in the machining cause the vessels to strain differently – resulting in different sensitivities
After calculating the vessel sensitivities, the strain data can be converted and compared to the measured pressure data
The converted strain data compares very well to the pressure data that was measured by the pressure transducers
The differential pressure system can now be calibrated by holding one vessel (Tension) at 1000 psi and increasing the other vessel (Compression) to 1000 psi in small increments
The differential data can be fitted to a linear line just like the Tension and Compression vessels … this results in the sensitivity of the Differential Pressure System
The Differential Pressure calibration has a sensitivity close to that of the Compression vessel
After calculating the Differential Pressure sensitivity, the measured strain data can be converted and compared to the measured pressure data
The converted strain data from the Differential Pressure sensor compares very well to the measured pressure data … only fluctuating 0 ~15 psi