Download
1 / 5
50 likes | 122 Views
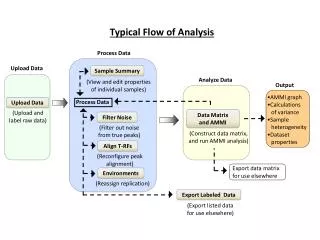
Dive into how oil, coal, and other contributors have impacted VOC emissions since 1950, with a focus on key pollutants and trends over time. Explore detailed calculations and scaling factors to understand the data.

E N D
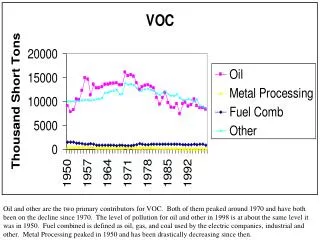
Oil and other are the two primary contributors for VOC. Both of them peaked around 1970 and have both been on the decline since 1970. The level of pollution for oil and other in 1998 is at about the same level it was in 1950. Fuel combined is defined as oil, gas, and coal used by the electric companies, industrial and other. Metal Processing peaked in 1950 and has been drastically decreasing since then.
Oil is the major contributor to Nitrous Oxide. Oil contributes about twice as much as the 2nd biggest contributor which is coal. Nitrous Oxide contribution by oil has nearly tripled since 1950. Coal has about doubled it’s Nitrous Oxide output since 1950. Fuel Combined is defined as the amount of gas used by the electric companies, industrial use, and the other fuel usage. Fuel combined has been decreasing since about 1970 and is at the level it was in 1950.
Coal is the biggest contributor of sulfur oxide. It produces about 4 times more sulfur oxide than the rest of the contributors. Coal peaked about 1970 and has been declining since then. Oil is producing less sulfur oxide than it did in 1950. Same is true as the “other”. Metal processing has nearly diminished in terms of producing sulfur oxide in 1998.
For the “other” contributors, it took a huge jump in PM 10 production in 1985. The “other” category produces about 3 times as much PM 10 as it did in 1950. Since 1950, the oil, metal processing and coal contributors have decreased since 1950. In 1990, coal and metal processing contributors were reduced by approximately 80%. Oil and “other” categories were reduced by approximately by 15% in 1990 as well.
Sample Calculations Nox Total Emission 1950 - 9,390 1960 - 13,482 NOx Oil Contributor 1950 - 4,226 1960 - 6,382 NOx Other Contributor 1950 - 1,036 1960 - 1,013 The total NOx emission went up by 43.58% from 1950 to 1960. The oil contributor went up by 51.02% from 1950 to 1960. The other contributor category went down by 2.23% from 1950 to 1960. NOx Total Emission Change 1950-1951: +4.40% Calculating a scaling factor & filling in the gaps As you can see, the overall NOx trend went up more than the individual contributors. This is where the scaling factor comes into play. Take the individual contributor percent change and divide by Total Emission percent change. IE: Oil contributor scaling factor is 51.02/43.58 = 1.17. Other contributor scaling factor is -2.23/43.58 = -0.051. Filling in the Gaps The equation I used was ((scale factor*yearly percent change)+1)*Previous year emission value