Download
1 / 32
320 likes | 500 Views
National-scale quantified analysis of future flood risk in the UK Paul Sayers Head of Floods and Water Management HR Wallingford, UK Jim Hall Professor of Earth Systems Engineering School of Civil Engineering and Geosciences Newcastle University, UK.

E N D
National-scale quantified analysis of future flood risk in the UK Paul SayersHead of Floods and Water ManagementHR Wallingford, UK Jim Hall Professor of Earth Systems Engineering School of Civil Engineering and Geosciences Newcastle University, UK
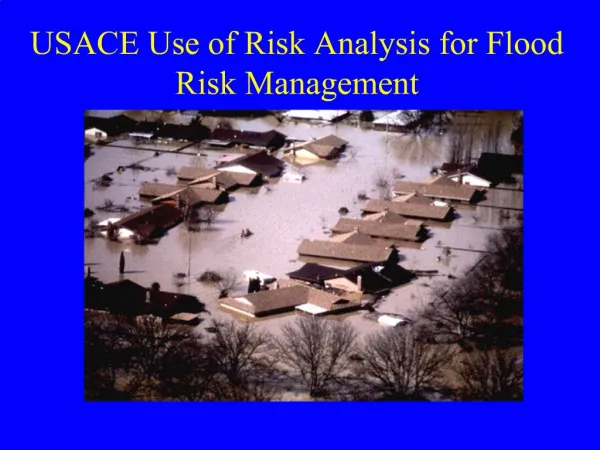
The traditional response to floods in the Thames (picture courtesy: Rachael Hill, Environment Agency)
The principles of quantified flood risk analysis National-scale flood risk analysis in the UK Foresight analysis of scenarios of future change in flood risk Foresight analysis of potential responses to changing flood risk Approximate analysis of the costs of responding to flood risk Contents
To quantify Risk: f(Probability.Consequence) To differentiate high risk from low risk areas and its change in time To support the identification of the: Most important factors influencing risk Drivers of future change in risk Most effective responses The aim of the quantified analysis
The flood risk system ….. exhibits spatial complexity
The RASP system risk modelUtilises a structured definition of the flood system……. Pathway (e.g. beach, defence and floodplain) Receptor (e.g. people in the floodplain) Source (River or sea)
The system risk modelComponents of the RASP model……. Source - Extreme water levels in rivers Defence system 2 (defences 1 to n) – incl. raised and non-raised defences and gates Pathway defence (overtopping, overflow, breaching) Source – Extreme water levels on coast Defence system 1 (defences 1 to n) incl. raised and non-raised defences and gates Limit of the undefended floodplain Receptor Impacts Pathway floodplain (flood inundation modelling)
Indicative Floodplain Maps (IFM) 1:50,000 maps with 5m contours (Composite DTM – 50m) National dataset of the centreline of all watercourses National Flood and Coastal Defence Database (35,000km of flood defences) National database of locations of residential and business properties (National Property Dataset) Data used in national-scale analysis
Distribution of the “Indicative” Flood Plain 10km/6m x 10km/6m grid)
The system risk modelBoard scale representation of levee type and performance Flood Defence Fluvial Coastal Type 1: Vertical Wall Type 2: Slope or Embankment Type 3: High Ground Type 4: Culvert Type 5: Vertical Seawall Type 6: Sloping seawall or dyke Type 7: Beach Narrow Wide Front slope protection Front and crest protection Front, crest and rear protection Front slope protection Front and crest protection Sheet piles & other materials Concrete structures Bricks and masonry Sheet piles & other materials Concrete structures Bricks and masonry
The system risk modelRepresenting levee performance Limited no. of parameters in the NFCDDsupport the definition of a High level fragility curve All sloping embankments
The system risk modelDetermining flood depth versus probability – accounting for system behaviour
The national system risk modelSpreading flood water…. All inundation scenarios Foresight 02 – we used a generalised statistical spreading technique... ….more recently… National flood risk assessment 2008 – we now use a physical based rapid spreading model (RFSM)
Results of national-scale analysis Example results from the national assessment 2008 (NaFRA, 08)
Foresight Futures + climate change scenarios Medium-low emissions Medium-high emissions High emissions and Low emissions Low emissions
Drivers Processes that change the state of the system Change in risk System state variables System analysis Sources rainfall sea level marine storms etc. Pathways urban surfaces fields, drains channels flood storage flood defences floodplains Receptors people houses industries infrastructure ecosystems Risk economic, risk to life, social, natural environment etc • . Translating drivers of change into the risk model….
Translating drivers of change into the risk model…. some examples
Results:Change in probability of flooding Present day values The four scenarios for the 2080s: change in risk
Results:Change in annual economic flood risk Present day values The four scenarios for the 2080s: change in risk
Drivers Processes that change the state of the system Change in risk System state variables System analysis Sources rainfall sea level marine storms etc. Pathways urban surfaces fields, drains channels flood storage flood defences floodplains Receptors people houses industries infrastructure ecosystems Risk economic, risk to life, social, natural environment etc Change in risk Responses Interventions that change the state of the system • .
Analysis of implementation costs Only the costs of engineering measures have been estimated (excluding non-structural interventions) Exclude land purchase, compensation or significant environmental mitigation Without non-structural measures the costs roughly double
Conclusions National-scale flood risk analysis... has been shown to be feasible in the UK, and is steadily improving yields results that are approximate, but do correspond to recent observed flood damages provides the basis for quantified policy analysis was used in the Foresight study to demonstrate that: the potential for future increases in risk is considerable, and due to a combination of factors application of a portfolio of measures can bring the risk down