Profit Maximizing Output
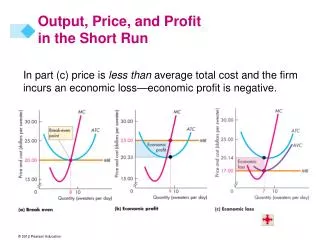
This article explores the complexities of firm behavior in economics, focusing on how to determine the optimal output level for profit maximization in both the short run and long run. It highlights the significance of the marginal cost (MC) curve and its relationship with average variable cost (AVC) and average total cost (ATC) curves. The marginal cost curve above AVC serves as the short-run supply curve, while the segment above ATC represents the long-run supply curve. Additionally, the concepts of producer surplus and equilibrium quantity (Qe) are discussed to illustrate profitability.

Profit Maximizing Output
E N D
Presentation Transcript
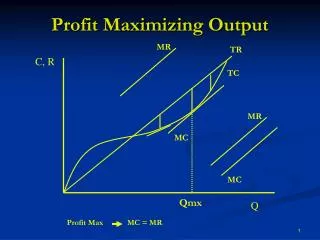
MR MR TR TC C, R MC MC Q Profit Max MC = MR Profit Maximizing Output Qmx
ATC MC AVC C Q Firm Behavior • How Much to Produce -- Short run – Long run The marginal cost curve, above AVC, is short run supply curve The marginal cost curve, above ATC, is long run supply curve
P S Pe Producer Surplus Producer Surplus D Qe Q Producer Surplus