Download
1 / 19
190 likes | 348 Views
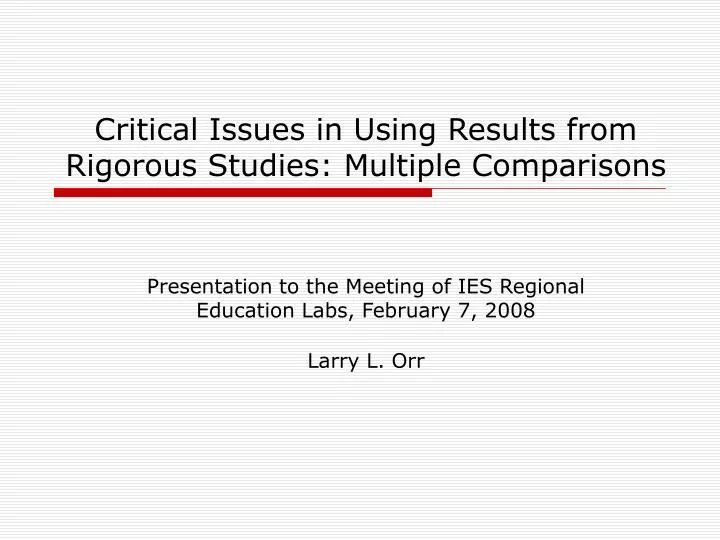
Critical Issues in Using Results from Rigorous Studies: Multiple Comparisons. Presentation to the Meeting of IES Regional Education Labs, February 7, 2008 Larry L. Orr. What are multiple comparisons and how do they arise?.

E N D
Critical Issues in Using Results from Rigorous Studies: Multiple Comparisons Presentation to the Meeting of IES Regional Education Labs, February 7, 2008 Larry L. Orr
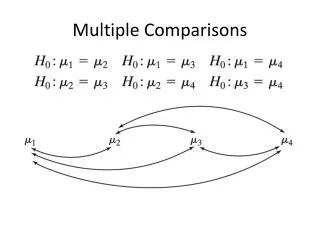
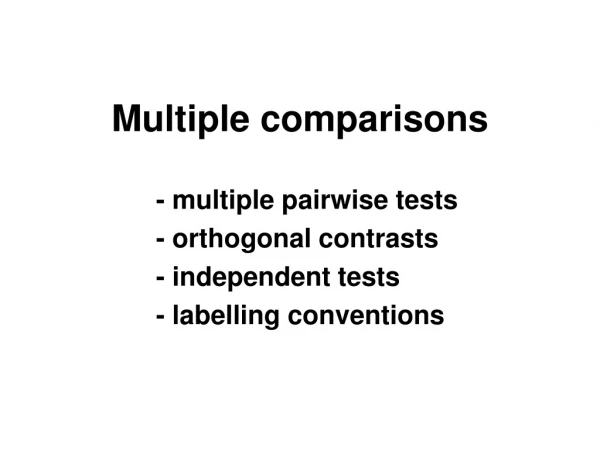
What are multiple comparisons and how do they arise? • “Multiple comparisons” = multiple estimates based on comparisons of different groups • Multiple comparisons arise from: • Multiple outcomes • Subgroup analysis • Multiple treatment arms Regional Educational Lab Directors Meeting
What are multiple comparisons and how do they arise? • “Multiple comparisons” = multiple estimates based on comparisons of different groups • Multiple comparisons arise from: • Multiple outcomes • Subgroup analysis • Multiple treatment arms Disclaimer: The views expressed here are not necessarily those of IES or the IES Methods Working Group Regional Educational Lab Directors Meeting
Why are multiple comparisons a problem? • At conventional levels of significance, the chance that a single estimate will be significant when there is no true impact = 5% • If we estimate 10 impacts, the chance that at least one will be significant when there are no true impacts = 40% • For 50 estimates, the chance that at least one will be significant when there are no true impacts = 92% Regional Educational Lab Directors Meeting
Why are multiple comparisons a problem? • At conventional levels of significance, the chance that a single estimate will be significant when there is no true impact = 5% • If we estimate 10 impacts, the chance that at least one will be significant when there are no true impacts = 40% • For 50 estimates, the chance that at least one will be significant when there are no true impacts = 92% Anytime you ask, “which of the following impact estimates is significant” you need to worry about multiple comparisons. Regional Educational Lab Directors Meeting
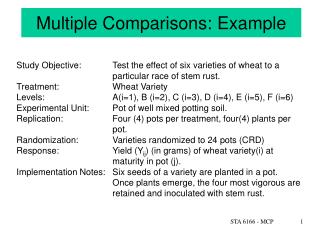
An Example • Suppose we estimate impacts on 10 outcomes for each of the following subgroups: • Gender • Ethnicity (4 groups) • Region (4 groups) • School size (2 groups) • Central city/Suburban/Rural • SES (3 groups) • Number siblings (4 groups) • Pretest score (3 groups) • 250 estimates – not atypical for an education study Regional Educational Lab Directors Meeting
Example (cont’d) • Suppose 20 estimates are significant at .05 level • That might reflect: • 20 true nonzero impacts • 15 true nonzero impacts and 5 false positives • 10 true nonzero impacts and 10 false positives • … • Expected mix = 8 true nonzero impacts, 12 false positives Regional Educational Lab Directors Meeting
Example (cont’d) • Suppose 20 estimates are significant at .05 level • That might reflect: • 20 true nonzero impacts • 15 true nonzero impacts and 5 false positives • 10 true nonzero impacts and 10 false positives • … • Expected mix = 8 true nonzero impacts, 12 false positives But you can never know what the actual mix is, and you cannot know which is which Regional Educational Lab Directors Meeting
The False Discovery Rate (FDR) • FDR = proportion of significant estimates that are false positives (Type I errors) • In previous example, if the mix was 8 true nonzero impacts and 12 false positives, FDR = .6 (= 12/20) • Low FDR is good • FDR is higher: • At lower significance threshold (e.g., α = .10 more false positives than α =.05) • If proportion of true zero impacts is higher (this proportion is, of course, unknowable) Regional Educational Lab Directors Meeting
FDR as function of proportion true zero impacts(assumes significance level = .05; power = .80) Regional Educational Lab Directors Meeting
Implications • When < 50% of true impacts are zero, FDR is relatively low (< .06) • As proportion of true zero impacts rises above 80%, FDR rises rapidly • When all true impacts are zero, FDR = 1 – i.e., all significant estimates are Type I errors (but you cannot know that they are!) • Review of studies posted on WWC suggests that median education study is somewhere near 50% Regional Educational Lab Directors Meeting
What can we do about it…at the analysis stage (i.e., when design is set)? • Minimize the number of estimates • Specify small # of estimates as key “confirmatory” estimates; explicitly label others “exploratory” (and accept higher FDR or lower power) • Be very cautious if only a small proportion of impacts are statistically significant • Adjust explicitly for multiple comparisons with one of several available statistical adjustments (Bonferroni, Benjamini-Hochberg, others) Regional Educational Lab Directors Meeting
Simulation results: FDR as function of true zero impact rate,unadjusted vs. B-H adjusted B-H adjusted line based on estimated impacts on 9 outcomes for 500 sets of 25 subgroups with simulated effect size (ES) = 0 and 25 subgroups with simulated ES = .20, using data from the ECLS-K Demonstration Regional Educational Lab Directors Meeting
Probability distribution of Type I error rate(true nonzero impact rate = .5) Based on estimated impacts on 9 outcomes for 500 sets of 25 subgroups with simulated effect size (ES) = 0 and 25 subgroups with simulated ES = .20, using data from the ECLS-K Demonstration Regional Educational Lab Directors Meeting
Probability distribution of FDR(true nonzero impact rate = .5) Based on estimated impacts on 9 outcomes for 500 sets of 25 subgroups with simulated effect size (ES) = 0 and 25 subgroups with simulated ES = .20, using data from the ECLS-K Demonstration Regional Educational Lab Directors Meeting
Probability distribution of Type II error rate (true nonzero impact rate = .5) Based on estimated impacts on 9 outcomes for 500 sets of 25 subgroups with simulated effect size (ES) = 0 and 25 subgroups with simulated ES = .20, using data from the ECLS-K Demonstration Regional Educational Lab Directors Meeting
The cost of adjusting for multiple comparisons at the analysis stage • Reducing the chance of Type I errors (false positives) increases the chance of Type II errors (missing true effects) • In this case, Type II error rate (probability of missing a true effect when there is one) went from .26 to .32 (i.e., power fell from .74 to .68) • An aside: biggest loss in power was due to smaller sample size of subgroups – power fell from .88 for the overall sample to .74 for the unadjusted subgroup estimates Regional Educational Lab Directors Meeting
What can we do at the design stage? • All the things Rebecca told you to do • Test only interventions that can reasonably be expected to have nonzero impacts • Build the loss of power associated with MC adjustments into the sample size, to maintain power (in the previous example, this would require about a 50% increase in sample size – sorry about that, Phoebe) Regional Educational Lab Directors Meeting
For a copy of this presentation… Send an e-mail to: Larry.Orr@comcast.net Regional Educational Lab Directors Meeting