Correction for multiple comparisons
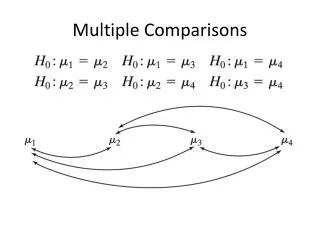
Correction for multiple comparisons. Problem of Multiple Comparisons. p < 0.01. p < 10 -7. p < 0.10. p value is probability that a voxel is falsely activated Threshold too liberal: many false positives Threshold too restrictive: lose activation (false negatives). Clusters. p < 0.01.

Correction for multiple comparisons
E N D
Presentation Transcript
Problem of Multiple Comparisons p < 0.01 p < 10-7 p < 0.10 • p value is probability that a voxel is falsely activated • Threshold too liberal: many false positives • Threshold too restrictive: lose activation (false negatives)
Clusters p < 0.01 p < 10-7 p < 0.10 - True signal tends to be clustered - False Positives tend to be randomly distributed in space - Cluster – set of spatially contiguous voxels that are above a given threshold.
Cluster-forming Threshold p<.00001 sig>5 p<.0001 sig>4 Unthresholded p<.001 sig>3 As threshold lowers, clusters may expand or merge and new clusters can form. No way to say what the threshold should be.
Cluster Table, Uncorrected p<.0001 sig>4 38 clusters ClusterNo Area(mm2) X Y Z Structure Cluster 1 3738.82 -11.1 34.5 27.2 superiorfrontal Cluster 2 5194.19 -32.4 -23.3 15.7 insula Cluster 3 1271.30 -25.9 -75.0 19.0 superiorparietal Cluster 4 775.38 -44.4 -9.7 51.3 precentral Cluster 5 440.56 -33.0 -36.8 37.5 supramarginal … How likely is it to get a cluster of a certain size under the null hypothesis?
Clusterwise Correction Supramarginal Gyrus Cluster 440.56 mm2 How likely is it to get a cluster 440.56mm2 or bigger by chance? How likely is it to get a cluster of a certain size under the null hypothesis?
Cluster-based Correction for Multiple Comparisons • Simulate data under Null Hypothesis: • Synthesize Gaussian noise and then smooth (Monte Carlo) • Permute rows of design matrix (Permutation, orthog.) • Analyze, threshold, cluster, get MaxClusterSizeNull • Repeat 10,000 times – gives a list of 10000 MaxClusterSizeNulls under the null • Analyze real data, get ClusterSize (eg, 440.56 mm2) • Count number of times MaxClusterSizeNull > ClusterSize P(cluster) = #(MaxClusterSizeNull > ClusterSize) /10000 Histogram of MaxClusterSizeNull mri_glmfit-sim
Cluster Table, Corrected p<.0001 sig>4 22 clusters out of 38 have cluster p-value < .05 ClusterNo Area(mm2) X Y Z Structure Cluster P Cluster 1 3738.82 -11.1 34.5 27.2 superiorfrontal .0001 Cluster 2 5194.19 -32.4 -23.3 15.7 insula .0003 Cluster 3 1271.30 -25.9 -75.0 19.0 superiorparietal .0050 Cluster 4 775.38 -44.4 -9.7 51.3 precentral .0100 Cluster 5 440.56 -33.0 -36.8 37.5 supramarginal .0400 … Note the difference between the Cluster Forming Threshold (p<.0001) and the Clusterwise p-value (eg, .04).
Clusterwise Correction Supramarginal Gyrus Cluster 440.56 mm2 Probability of getting a cluster 440.56mm2 or bigger by chance is p=.04 This is the clusterwise p-value.
Surface-based Correction for Multiple Comparisons • 2D Cluster-based Correction at p < .05 mri_glmfit-sim --glmdir lh.gender_age.glmdir --cache pos 2 --2spaces --cwpvalthresh .05
Original mri_glmfit command: mri_glmfit --y lh.thickness.sm10.mgh --fsgd gender_age.txt --C age.mtx –C gender.mtx --surf fsaverage lh --cortex --glmdir lh.gender_age.glmdir Surface-based Correction for Multiple Comparisons • 2D Cluster-based Correction at p < .05 mri_glmfit-sim --glmdir lh.gender_age.glmdir --cache pos 2 --2spaces --cwpvalthresh .05 lh.gender_age.glmdir/ beta.mgh – parameter estimates rvar.mgh – residual error variance age/ sig.mgh – -log10(p), uncorrected gamma.mgh, F.mgh gender/ sig.mgh – -log10(p), uncorrected gamma.mgh, F.mgh
Surface-based Correction for Multiple Comparisons • 2D Cluster-based Correction at p < .05 • Use pre-computed simulation results • positive contrast • voxelwise threshold thres = 2 (p<.01) • Can do another simulation or permutation • Not related to recon-all -qcache mri_glmfit-sim --glmdir lh.gender_age.glmdir --cache pos 2 --2spaces --cwpvalthresh . 05
Surface-based Correction for Multiple Comparisons • 2D Cluster-based Correction at p < .05 Cluster-wise threshold p<.05 cw = cluster-wise pval = p value thresh = threshold mri_glmfit-sim --glmdir lh.gender_age.glmdir --cache pos 2 --cwpvalthresh .05 --2spaces
Surface-based Correction for Multiple Comparisons • 2D Cluster-based Correction at p < .05 Doing analysis with left hemi but right hemi will be done separately. Need to correct for full search space. mri_glmfit-sim --glmdir lh.gender_age.glmdir --cache pos 2 --cwpvalthresh .05 --2spaces
Correction for Multiple Comparisons Output mri_glmfit-sim --glmdir lh.gender_age.glmdir --cache pos 2 --cwpvalthresh .05 --2spaces lh.gender_age.glmdir age gender sig.mgh – pre-existing uncorrected p-values cache.th20.pos.sig.cluster.mgh– map of significance of clusters cache.th20.pos.sig.ocn.annot– annotation of significant clusters cache.th20.pos.sig.cluster.summary – text file of cluster table (clusters, sizes, MNI305 XYZ, and their significances) • Only shows clusters p<.05, change –cwpvalthesh to • a larger value to get more (ie, less sig) clusters
Corrected Outputs cache.th20.pos.sig.ocn.annot– annotation of significant clusters cache.th20.pos.sig.cluster.summary -- text file of cluster table ClusterNo Area(mm2) X Y Z Structure Cluster P Cluster 1 3738.82 -11.1 34.5 27.2 superiorfrontal .0001 Cluster 2 5194.19 -32.4 -23.3 15.7 insula .0003 Cluster 3 1271.30 -25.9 -75.0 19.0 superiorparietal .0050 Cluster 4 775.38 -44.4 -9.7 51.3 precentral .0100 Cluster 5 440.56 -33.0 -36.8 37.5 supramarginal .0400 …
False Discover Correction Possible • False Discovery Rate (FDR) – built into tksurfer and QDEC. (Genovese, et al, NI 2002)
Tutorial • Command-line Stream • Create an FSGD File for a thickness study • Age and Gender • Run • mris_preproc • mri_surf2surf • mri_glmfit • mri_glmfit-sim • tksurfer • QDEC – same data set
QDEC – An Interactive Statistical Engine GUI • Query – Select subjects based on Match Criteria • Design – Specify discrete and continuous factors • Estimate – Fit Model • Contrast – Automatically Generate Contrast Matrices • Interactive – Makes easy things easy (that used to be hard) • …a work in progress • No Query yet • Two Discrete Factors (Two Levels) • Two Continuous Factors • Surface only
QDEC – Spreadsheet qdec.table.dat – spreadsheet with subject information – can be huge! fsid gender age diagnosis Left-Cerebral-White-Matter-Vol 011121_vc8048 Female 70 Demented 202291 021121_62313-2 Female 71 Demented 210188 010607_vc7017 Female 73 Nondemented 170653 021121_vc10557 Male 75 Demented 142029 020718_62545 Male 76 Demented 186087 020322_vc8817 Male 77 Nondemented 149810 gender.levels diagnosis.levels Discrete Factors need a factorname.level file Female Male Demented Nondemented
QDEC GUI • Load QDEC Table File • List of Subjects • List of Factors (Discrete and Cont) • Choose Factors • Choose Input (cached): • Hemisphere • Measure (eg, thickness) • Smoothing Level • “Analyze” • Builds Design Matrix • Builds Contrast Matrices • Constructs Human-Readable Questions • Analyzes • Displays Results