Download
1 / 49
490 likes | 757 Views
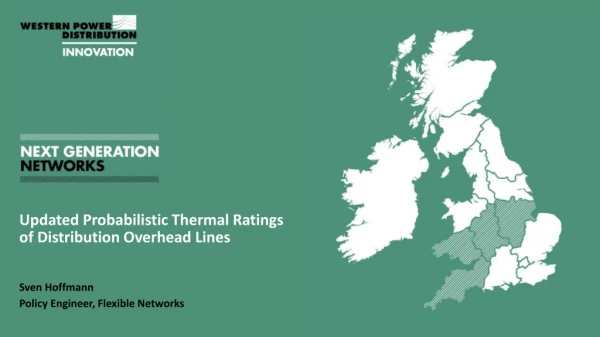
Updated Probabilistic Thermal Ratings of Distribution Overhead Lines Sven Hoffmann Policy Engineer, Flexible Networks. Outline. NIA Project Summary Outline of Rating Methodology NIA Project Progress & Early Results Application of Ratings - Building a Risk Model

E N D
Updated Probabilistic Thermal Ratings of Distribution Overhead Lines Sven Hoffmann Policy Engineer, Flexible Networks
Outline NIA Project Summary Outline of Rating Methodology NIA Project Progress & Early Results Application of Ratings - Building a Risk Model Application of Ratings – Enhanced Application Next Steps Improved Statistical Ratings for Overhead Lines
NIA Project – Summary Improved Statistical Ratings for Overhead Lines • Aim: to provide DNO’s with up-to-date, reliable, and flexible overhead line ratings • Duration: 3 years – July 2015 to June 2018 • Including 2 years’ data acquisition • Main deliverables: • Update ENA ER P27 (nationally applicable ratings) • Software tool to provide DNO flexibility in derivation and application of ratings
Background - OHL Ratings Today Improved Statistical Ratings for Overhead Lines • UK overhead line ratings are probabilistic, and given in ENA ER P27 • They are expressed as having a certain “exceedence” - the risk of a conductor exceeding its design temperature • The “3%” rating, for example, carries a 3% chance of a conductor’s temperature rising above its design temperature when full rated current is applied
Background - Calculation of Ratings Improved Statistical Ratings for Overhead Lines • Probabilistic ratings are calculated by applying a scaling factor to a reference rating – a rating calculated from a reference set of weather conditions by applying standard heat balance equations • A function linking the scaling factor to the desired risk level was derived by experiment by the CEGB, Leatherhead, in the late 1970s / early 1980s
CERLCT vs Te Improved Statistical Ratings for Overhead Lines
NIA Project – Problem (1) Improved Statistical Ratings for Overhead Lines • Recent work carried out as part of the Strategic Technology Programme concluded that assumptions used in the CEGB work were erroneous • A changing climate over the last 35+ years has further invalidated that original work • ENA ER P27 is no longer considered reliable
NIA Project – Project Aim (1) Improved Statistical Ratings for Overhead Lines • To redefine the function linking reference rating to probabilistic rating • Same basic methodology as used by CEGB • Designing the experiment to minimise the need for problematic assumptions (e.g. seasonal boundaries) • Outcome to allow more reliable UK overhead line ratings to be calculated • Deliverable: Updated ENA ER P27
NIA Project – Problem (2) Improved Statistical Ratings for Overhead Lines • Climate continues to change with time, and is variable geographically • Experimentally derived function highly unlikely to remain valid indefinitely • Function could also be adapted to different regions • Repeating the experiment is very expensive and time consuming • The ability to re-run the experiment “virtually” would be very beneficial
NIA Project – Project Aim (2) Improved Statistical Ratings for Overhead Lines • Deliverable: A software tool allowing DNOs the flexibility to produce tailored ratings • With weather data and/or current load profiles as inputs, conductor temperature profiles can be calculated • Regional or even line specific ratings could be derived, incorporating load profiles if desired • Weather data could be logged locally, or produced by specialist provider (hindcast)
NIA Project – Progress (1) Improved Statistical Ratings for Overhead Lines • Test rig constructed at WPD’s Stoke Depot • 4 circuits / 3 conductor sizes continuously loaded at 3 different current levels for 2 years • Conductor temperatures, Ambient temperature, Wind Speed, and Wind Direction monitored • 2-year monitoring period was completed January 2018
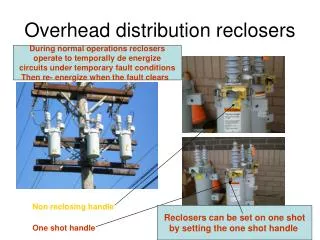
Test Rig • Located at WPD Stoke depot • Considered broadly representative of UK 11kV • 4 Circuits, 30m spans, each energised at constant current • Weather monitoring • Ambient Temperature • Wind Speed • Wind Direction • Solar Radiation • Rainfall • Embedded thermocouples for conductor temperature measurement • Arranged in trios, mid-span
Test Rig Circuits Improved Statistical Ratings for Overhead Lines
NIA Project – Progress (1) cont. Improved Statistical Ratings for Overhead Lines • Analysis of data has lead to a better picture of seasonal boundaries • Using 4 seasons instead of 3 indicated as more appropriate. • New reference weather parameters • New, universal “Ct” curve linking reference rating to probabilistic rating
Seasonal Boundaries Improved Statistical Ratings for Overhead Lines • Choices should be relevant to network studies - Network models assume seasonality of loads correlated with weather & climate • Choices should minimise variability of risk within and across seasons • Absolute accuracy of getting the months right not necessary if network loading and prevailing weather are correlated
Seasonal Boundaries Improved Statistical Ratings for Overhead Lines
Seasonal Boundaries - Summary Improved Statistical Ratings for Overhead Lines • Old • Winter: Dec / Jan / Feb • “Normal”: Mar / Apr / Sep / Oct / Nov • Summer: May / Jun / Jul / Aug • New • Winter: Dec / Jan / Feb • Intermediate (Cool): Mar / Apr / Nov • Intermediate (Warm): Sep / Oct / Apr • Summer: Jun / Jul / Aug
Reference Weather Parameters – P27 Improved Statistical Ratings for Overhead Lines • Wind Speed: 0.5 m/s • Wind Angle: 12.0° ** • Solar: 0 • Ambient: • Winter: 2 °C • “Normal”: 9 °C • Summer: 20 °C
Reference Weather Parameters – New (initial) Improved Statistical Ratings for Overhead Lines • No change to wind & solar • Use a “sensible” guess for new seasonal ambient: • Winter: 2 °C • Intermediate (cool): 6 °C • Intermediate (warm): 12 °C • Summer: 20 °C
CT vs Te Curves – Guessed Ambient Improved Statistical Ratings for Overhead Lines
Excursions – Guessed Ambient Improved Statistical Ratings for Overhead Lines
Reference Weather Parameters – New (improved) Improved Statistical Ratings for Overhead Lines • No change to wind & solar • Use Stoke measurements for new seasonal ambient: • Winter: 3.6 °C • Intermediate (cool): 6.6 °C • Intermediate (warm): 11 °C • Summer: 14.3 °C
CT vs Te Curves – Measured Ambient Improved Statistical Ratings for Overhead Lines
Excursions – Measured Ambient Improved Statistical Ratings for Overhead Lines
Reference Weather Parameters – Final Improved Statistical Ratings for Overhead Lines • Using Stoke ambient measurements to derive reference ratings results in CT vs Te curves with minimal scatter • This shouldn’t be unexpected • Using UK long term averages will result in more scattered curves, but this should be expected • Annual, seasonal variations are to be expected • View is that UK long term averages are most appropriate, and provide a clear basis for future reviews
Reference Weather Parameters – Final Improved Statistical Ratings for Overhead Lines • Ambient • Winter: 4 °C • InterCool: 6 °C • InterWarm: 11 °C • Summer: 14 °C • Wind: 0.5m/s @ 12° Angle of Attack • Solar: 0 W/m2
NIA Project – Progress (2) Improved Statistical Ratings for Overhead Lines • Logged data used to successfully validate heat balance equations & temperature calculation methodology • Software code completed allowing conductor temperatures and reference ratings to be calculated • Code initially used for data analysis, subsequently incorporated into software tool deliverable
Hindcast Datasets & Calculated Temperatures Improved Statistical Ratings for Overhead Lines • “Hindcast” datasets procured from both Met Office and Digital Engineering • Digital Engineering dataset coincident with Stoke experiment • Ct curves derived from new reference weather parameters and calculated conductor temperatures
Hindcast Datasets - Applicability Improved Statistical Ratings for Overhead Lines • Results of using hindcast datasets variable. Firm conclusions difficult to draw. • Digital Engineering data gives low scatter but is highly conservative – hourly average winds, rather than minimum winds, give closest agreement. • Met Office data gives higher scatter but best agreement vs temperatures calculated from logger data (“on-hour” 10min mean)
Application of Ratings - Building a Risk Model Ultimately, we use (and obey!) overhead line ratings in order to avoid electrical flashovers resulting from excessive sag The UK’s regulations – ESQCRs – allow for an element of risk • Clearances must be maintained at a conductor’s likely maximum temperature What is an appropriate level of risk for flashover, and how does this determine the tolerable exceedence to be chosen in order to derive CT. Improved Statistical Ratings for Overhead Lines
Building a Risk Model – Flashover Flashover requires a combination of events: • An infringement of design clearances – P(Clear) • Sufficient to result in breakdown of air insulation • To a “limit case” obstacle – P(Obstacle) • Some obstacles fixed (buildings) • Some obstacles variable (vehicles, people) • Under limit case voltage conditions – P(Volts) • Switching surge? Power frequency? Improved Statistical Ratings for Overhead Lines
Building a Risk Model (1) Improved Statistical Ratings for Overhead Lines
Building a Risk Model – Clearance A clearance infringement further requires: • A conductor temperature excursion – P(Temp) • Greater than the line’s design / profile temperature • By a margin sufficient to overcome any “fat” in the line’s design – P(Design) • Line geometry will often result in clearances greater than required by design standards • Structure height increments • Structure placement / span length limitations Improved Statistical Ratings for Overhead Lines
Building a Risk Model (2) Improved Statistical Ratings for Overhead Lines
Building a Risk Model – Temperature A temperature excursion further requires: • A line (current) loading greater than the minimum “zero exceedence” rating – P(Load) • While the prevailing weather conditions provide insufficient cooling – P(Weather) In this context P(Weather) is the “Exceedence” Improved Statistical Ratings for Overhead Lines
Building a Risk Model (3) Improved Statistical Ratings for Overhead Lines
Note - Flexible Networks Improved Statistical Ratings for Overhead Lines • Originally aimed to have new P27 incorporate a “standard” load duration curve and, therefore, a standard value of P(Load) • Alternative connection schemes and renewables now mean that this is no longer considered appropriate • Software tool will, however, allow DNOs to consider load scenarios themselves • P27 ratings will be based on conservative values
Application of Ratings – Enhanced Application Impossible for one document, P27, to cover all possible rating scenarios Software tool will allow DNOs (DSOs??) to assess risk levels for any load / weather scenarios desired Improved Statistical Ratings for Overhead Lines
Custom Ratings - Opportunities With better information, favourable correlations could be exploited, particularly wind farm connections • High wind = High output = High rating Unfavourable correlations could be explored in more depth, particularly for PV connections • High solar = High output = Low? Not-so-low? rating Improved Statistical Ratings for Overhead Lines
Next Steps Improved Statistical Ratings for Overhead Lines • Closedown report due end of September 2018 with final conclusions and recommendations. • Closedown Report to act as replacement / updated ACE104 • Recommendations will form basis for updated P27 in conjunction with software • Full datasets will be available for further study
THANKS FOR LISTENING Sven Hoffmann Western Power Distribution Policy Engineer, Flexible Networks wpdinnovation@westernpower.co.uk www.westernpowerinnovation.co.uk