Download

1 / 91
1.23k likes | 2k Views
Overhead distribution. Departmentalization. 1 Process of dividing the factory into number of Segments Is called Departmentalization. P1. P2. P3. S1. S1. Prod Departments. Service Dept. Departmentalization.

E N D
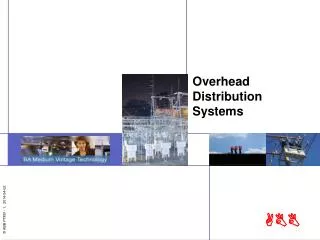
Overhead distribution
Departmentalization 1 Process of dividing the factory into number of Segments Is called Departmentalization P1 P2 P3 S1 S1 Prod Departments Service Dept.
Departmentalization 2 Process of allocating and apportioning POHEs to different departments or cost centers (Prod & Service ) Factory Overheads P1 P2 P3 S1 S1 Prod Departments Service Dept.
Departmentalization Factory Overheads Allocation & Apportionment P1 P2 P3 S1 S1 Prod Departments Service Dept.
Service Departments Repair Department Maintenance Department Power House Fire Protection Canteen Purchase Tool Room Personnel Department Stores Boiler House Time-Keeping Transport
Distribution of Overhead ALLOCATION APPORTIONMENT Common Costs Specific Costs
Distribution of Overhead ALLOCATION Allocating whole amount Of an item of POHs to the department for which The expenditure was incurred Specific Costs
Distribution of Overhead APPORTIONMENT Common costs are apportioned Amongst different departments or cost centers on some basis Common Costs
Principal Basis of Apportionment Of Overheads • Floor Area • Capital Value Of Assets • Number Of Employees • Machine Hours • Direct Labour Hours • Light Points • Kilowatt Hours • Technical Analysis
BASIS FOR APPORTIONMENT Rent, Rates & Taxes, Lighting & Heating Insurance & depreciation of Building, Cost of repairs & maintenance of Building, Air Conditioning Floor Area Occupied Capital Value Insurance & Depreciation on Plant & Machinery, maintenance of PM, Insurance on building, etc
BASIS FOR APPORTIONMENT No.Of Employees Welfare Expenses, time-Keeping ,pay-roll Office, Canteen, Recreation, Supervision Medical Expenses Machine Hours Repairs & Maintenance of Plant & Machinery
BASIS FOR APPORTIONMENT Direct Labour Hrs Work’s Manager’s Remuneration, Salary of Supervisors etc Light Points Or Kilowatt Hours Electricity Charges
BASIS FOR APPORTIONMENT Technical Estimate Where not possible to apportion on some Bases Technical estimate is made Horse Power Motive Power Expenses
BASIS FOR APPORTIONMENT Value or Weight of Materials Store Keeping Expenses Truck Mileage Tonnage Truck Hours No.Of Pakages Transport Service Expenses
PRINCIPLES OF APPORTIONMENT Utility or Service Principle Survey Method Ability To Pay Efficiency Principle
PRINCIPLES OF APPORTIONMENT Utility or Service Principle Service or Benefits received By the department
PRINCIPLES OF APPORTIONMENT Ability To Pay What the Traffic can bear Basis of Sales or Profit
PRINCIPLES OF APPORTIONMENT Survey Method When Difficult to select Basis Production Manager’s Salary (Time spent in Each Dept)
PRINCIPLES OF APPORTIONMENT Out put as the basis Higher Production Low Overhead Rate Low Production High OH Rate Efficiency Principle
Quick Check Identify the Basis for following Overheads Rent Plant Repairs Power Depreciation of Building Building Repairs Insurance Of Building Fire Insurance of Stock Lighting Expenses Supervision Power ESI Employer’s Cont. to PF Amenities To Staff Canteen Gn. Overheads • Floor Area • Value of Plant • Machine Hours/HP/VM • Value Of Building • Value Of Building • Floor Area • Value Of Stock • No.Of Light Points • No.Of Employees • Kilowatt/Value of Plant • Direct Wages • Direct Wages • No.Of Employees/Wages • No.Of Employees • Direct Wages
Summary Of Departmental Overhead Distribution Production Departments Total (Rs) Particulars Basis A B C D (Rs) (Rs) (Rs) (Rs) Rent Area(15:11:9:5) 2,000 750 550 450 250 Plant Maintenance Value Of Mch. (4:3:2:1) 1,200 480 360 240 120 Depreciation Value Of Mch. (4:3:2:1) 900 360 270 180 90 Lighting Area(15:11:9:5) 200 75 55 45 25 Insurance Stock Value(5:3:2) 1,000 500 300 200 -- Employer's Cont to PF Wages (4:3:2:1) 300 120 90 60 30 Energy Value Of Mch. (4:3:2:1)1,800 720 540 360 180 Supervision No.Of Emp (6:4:3:2) 3,000 1,200 800 600 400 Total 10,400 4,205 2,965 2,135 1,095
Summary Of Departmental Overhead Distribution Production Dept. SD Total (Rs) Particulars Basis A B C D (Rs) (Rs) (Rs) (Rs) Rent Area 10,000 3,750 2,750 2,250 1,250 Repairs To Plant Value Of Plant 6,000 2,400 1,800 1,200 600 Depreciation “ 4,500 1,800 1,350 900 450 Lighting Light Points 1,000 375 275 225 125 Supervision No Of Employees 15,000 6,000 4,500 3,000 1,500 Fire Insurance Value Of Stock 5,000 2,500 1,500 1,000 - Power Value Of Plant 9,000 3,600 2,700 1,800 900 ESI Wages 1,500 600 400 300 200 Total 52,000 21,500 15,27510,675 5,025
Redistribution of Overheads Reapportionment of Overheads Secondary Distribution Of Overheads
ACCOUNTING(FINANACIAL & COST) OF ICMAP STAGE 1,2,3,4 (NEW CLASSES) CA..MODULE B,C,D PIPFA (FOUNDATION,INTERMEDIATE,FINAL) ACCA-F1,F2,F3 BBA,MBA B.COM(FRESH),M.COM MA-ECONOMICS..O/A LEVELS KHALID AZIZ….. 0322-3385752 0312-2302870 0300-2540827 JOIN KHALID AZIZ
ProductionDepartments ServiceDepartments Carry out the central purposesof an organization. Provide supportthat facilitates theactivities of production departments. Service Department Cost Re-Apportionment
First, we identify the factor that drives costs in theservice department. Thiscost driver is usedas theapportionment base. How are servicedepartment costscharged to operatingdepartments? The Need for Cost Re-Apportionment
Second, we measure theconsumption of theapportionment base in theoperating departments. The Need for Cost Apportionment
Third, we apportionthe servicedepartment costbased on therelative amount of the apportionment baseused in eachoperating department. The Need for Cost Apportionment
What happens toservice departmentcosts after theyare apportioned tooperatingdepartments? Apportioned service departmentcosts become a part ofthe overhead in eachoperating department. The Need for Cost Apportionment
First Stage Apportionment Service department costs are apportioned to operating departments. The Need for Cost Apportionment Service Department (Cafeteria) Operating Department (Machining) Service Department (Accounting) The Products Operating Department (Assembly) Service Department (Personnel)
Second Stage Apportionment Operating department overhead costs and apportioned service department costs are applied to products. The Need for Cost Apportionment Service Department (Cafeteria) Operating Department (Machining) Service Department (Accounting) The Products Operating Department (Assembly) Service Department (Personnel)
Criteria Easiest Selecting Apportionment Bases Personnel: Number ofemployees Custodial: Squarefootage Receiving: Unitshandled Cafeteria: Number ofemployees Accounting: Staffhours Security: Squarefootage Power: Kilowatthours
Re- apportionment Basis No of Purchase Orders or value of Materials Purchased for each Production Department Purchase Department • Value or Quantity of Materials Issued • No. Of Materials Requisitions Stores
Re- apportionment Basis Internal Transport Weight & Distance Inspection Hrs. Devoted to each Department inspection
Re- apportionment Basis Time Keeping, Security Canteen Welfare Recreation Medical Personnel Pay Roll • Number Of Employees • Total Labour Hours or • Wages or Salaries
Re- apportionment Basis Maintenance Department Hrs. Devoted or Worked for Each Department No .Of Employees Factory Office
Re- apportionment Basis Building Service Deptt Relative Area Of Each Deptt % Of Steam Utilized Boiler House
Interdepartmental Services Problem Re Apportioning costs when service departmentsprovide services to each other Solutions Direct Method Step method Reciprocal method
Interactionsbetween service departments areignored and all costs areallocated directlyto operatingdepartments. Direct Method Service Department (Cafeteria) Operating Department (Machining) Service Department (Custodial) Operating Department (Assembly)
20 20 + 30 INR 360,000 × =INR 144,000 Direct Method Example Apportionment base: Number of employees
30 20 + 30 INR 360,000 × = INR 216,000 Direct Method Example Apportionment base: Number of employees
25,000 25,000 + 50,000 INR 90,000 × = INR 30,000 Direct Method Example Apportionment base: Square feet occupied
50,000 25,000 + 50,000 INR 90,000 × = INR 60,000 Direct Method Example Apportionment base: Square feet occupied
Bharat Engineering Works Departmental Overhead Distribution Statement (For 12 Months)
Once a servicedepartment’s costsare apportioned, other servicedepartment costsare not allocatedback to it. Step Method Service Department (Cafeteria) Operating Department (Machining) Service Department (Custodial) Operating Department (Assembly)