Theory and Applications of Grid Computing in Data Analysis
240 likes | 338 Views
Explore the benefits of Grid computing in data analysis with examples from Astrophysical Virtual Observatories and Enterprise Computing. Learn about virtual organizations, cloud computing, and volunteer computing in this comprehensive guide.

Theory and Applications of Grid Computing in Data Analysis
E N D
Presentation Transcript
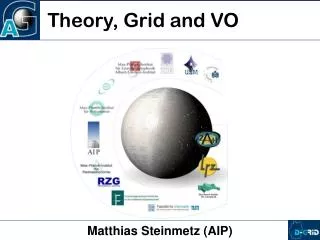
Theory, Grid and VO Matthias Steinmetz (AIP)
Data analysis Data Archive Data Archive PC Cluster PC Cluster application Data analysis Super Computer Super computer Telescopes Characteristics of a Grid: network of IT-Ressourcen MIDDLEWARE User Resources are "virtualized", i.e. can not be identified individually
VO and Grid • What is the dividing line between VO and Grid? • Not well defined • Example UK: • AstroGrid covers VO and Grid aspects • Example Germany • GAVO: application layer • AstroGrid-D: middle ware
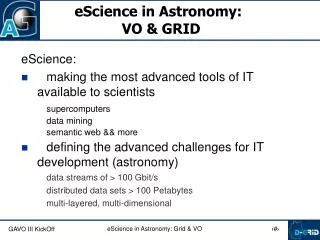
Theory and Grid • Benefits of the Grid • Logistics (resource monitoring, scheduler/broker, virtual organizations, …) • Virtual Surveys (Millenium simulation) • Enterprise computing (access to supercomputers via grids, e.g. DEISA) • Cloud computing (“task farming”) • Volunteer computing (@home model) • Visualization
StellarIS: resource monitoring Grid-Ressource-Map Basiert auf GoogleMap
Stellaris: Job monitoring Minutes Time table for submitted Jobs hours days Webinterface for simple job monitoring
Analysing Cosmological Simulations in the Virtual Observatory:Designing and Mining the Millennium Simulation Database Gerard Lemson German Astrophysical Virtual Observatory ARI, Heidelberg MPE, Garching bei München
Merger trees : select prog.* from galaxies des , galaxies prog where des.galaxyId = 0 and prog.galaxyId between des.galaxyId and des.lastProgenitorId Branching points : select descendantId from galaxies des where descendantId != -1 group by descendantId having count(*) > 1
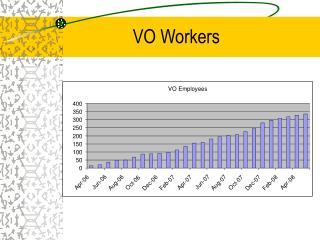
Usage statistics • Up since August 2006 (astro-ph/...) • ~210 registered users • > 4.4 million queries • ~ 35 billion rows (since March 2007) # secs/day # queries/day # rows/day
Enterprise Computing:Mare Nostrum Simulations at HLRZ WMAP3 parameters, w=0.8 Testrun using the grid: 10243+10243 particles
NBODY6++ UseCase Computer simulation of dense stellar systems Example: globular clusters Gravitational Star-Star interaction Complexity N2 (N: number of stars)
Enterprise Computers Recent Development: GPU – Graphics Cards GeForce 8800 GTX (NVIDIA) Using CUDA Library Special Interfaces and API from GRACE project ported. Berczik et al. 2008 Spurzem et al. 2008
Cloud Computing: UseCase DynamoVisualization of results 2D-Darstellung der Magnetfeldstärke auf der Sternoberfläche Querschnitt durch den Stern Rechner 1 Rechner 2 Rechner 3 Rechner 4
Dynamo JDSL und RSL <jsdl:JobDefinition xmlns="http://www.gacg-grid.de/namespaces/job-mgmt/2006/08/jsdl" xmlns:jsdl="http://schemas.ggf.org/jsdl/2005/11/jsdl" xmlns:jsdl-posix="http://schemas.ggf.org/jsdl/2005/11/jsdl-posix" xmlns:xsi="http://www.w3.org/2001/XMLSchema-instance"> <jsdl:JobDescription> <jsdl:JobIdentification> <jsdl:JobName> Sample Dynamo run </jsdl:JobName> <jsdl:Description> Use Case Dynamo </jsdl:Description> <jsdl:JobProject> n/a </jsdl:JobProject> </jsdl:JobIdentification> <jsdl:Resources> <jsdl:FileSystem name="HOME"> <jsdl:Description> User's home directory </jsdl:Description> </jsdl:FileSystem> </jsdl:Resources> […] <?xml version="1.0" encoding="UTF-8"?> <job> <executable>test.x</executable> <directory>/${GLOBUS_USER_HOME}/ dynamo</directory> <stdout>test.out</stdout> <maxWallTime>100</maxWallTime> <maxMemory>1</maxMemory> <fileStageIn> […]
Volunteer Computing: GEO600 / LIGO Laser Interferometer Gravitational Wave Observatory
GEO600/LIGO Network von 4 Detectors Hanford (2000m side length) USA Livingston (4000m side length) USA GEO600 ( 600m side length) Germany Virgo (3000m side length) Italy Pathfinder for LISA, Satellite mission with 3 detectors side length: 5*109 m!
Gravitationional waves: Data analysis via the Grid • Data analysis via small data packages, “embarrassingly parallel”. • Einstein@Home is, like SETI@Home, suitable to exploit idle cycles on work stations. • Einstein@Home is an ideal, simple Grid application, supporting many operation system. • Checkpointing and Recovery allows a very accurate control of CPU-Requirements and walltime. • Automatic software deployment job submission and job management, a good scalability of grid application can be obtained • Current workload: 30000 CPU h per week
GEO600 – Resource Integration • user friendly User-Management viaVOMRS • Resource information via MDS und StellarIS • Grid Service Monitoring • automatic job submission on D-Grid resources • Job monitoring und job management using a Laptop • data management on Astrogrid-D Storage Cluster
Visualization of a galaxy merger Submit Execution ... ZIB AIP ARI Video Workflow A ProC Submit Workflow Video Workflow B start GT4 submit exit GT4 submit exit stop • Simulation: two galaxies on collision orbit • Visualization: 2D-projections of 3D snapshots
Grid-Visualization • Submission Host: ZIB • ProC + Master workflow • Submission of video workflows • Display of videos • Execution Hosts: AIP + ZAH • PiCo + Video workflow • Projection to 2D • Color coding • Future: • Graphics rendering at LRZ, graphics output on local host
Theory and Grid • Benefits of the Grid • Logistics (resource monitoring, scheduler/broker, virtual organizations, …) • Virtual Surveys (Millenium simulation) • Enterprise computing (access to supercomputers via grids, e.g. DEISA) • Cloud computing (“task farming”) • Volunteer computing (@home model) • Visualization