Phosphorus Index-Based Management in Agriculture: Strategies for Nutrient Balancing
260 likes | 381 Views
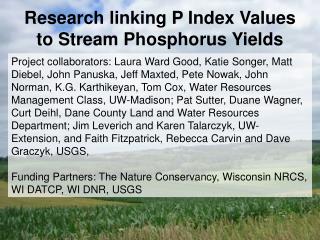
This document provides a comprehensive overview of the Phosphorus Index (P Index) used in nutrient management for agricultural systems, particularly focusing on corn and dairy manure. It discusses the need for a P Index beyond traditional agronomic recommendations, highlighting the critical source areas for phosphorus loss, and methods to manage phosphorus export effectively. The document includes insights on transport mechanisms, soil testing, and the balance of nitrogen and phosphorus in agricultural practices, aiming to minimize environmental risks associated with phosphorus pollution.

Phosphorus Index-Based Management in Agriculture: Strategies for Nutrient Balancing
E N D
Presentation Transcript
Phosphorus Index Based Management Douglas Beegle Dept. of Crop and Soil Sciences Penn State University dbb@psu.edu http://panutrientmgmt.cas.psu.edu
Animals Feed Crops Soil P2O5 P2O5 K2O K2O Why do we need a P Index?Why not just agronomic recommendations? ¼ Nitrogen Based Corn/Dairy Manure Nutrient flows in modern ag ¾ ? N P Index Manure P Index Phosphorus Based Corn/Dairy Manure Eutrophication Regional P Balance N Field P Balance
P Index Critical Source Area Management • Overlap of Source & Transport Indicators • Identify and manage the critical source areas • Evaluate environmental risk • Target effort and resources Critical Source Area Source Transport
Critical Areas of P Export 90% of annual P export comes from 10% of land area 90% of P Loss comes from 10% of the watershed Mahantango Creek Watershed, USDA-ARS
N P K Managing Phosphorus Pollution Transport Sources Runoff Erosion Leaching Tile flow Subsurface flow Water Body Hydrology
2.4 1.6 0.8 0 400 600 800 200 0 Soil Test vs P Loss P loss, lb P2O5/A P Threshold Crop P Optimum No recent P inputs R2=0.80 Mehlich-3 soil P, mg/kg Sharpley, USDA-ARS
N P K Managing Phosphorus Pollution Transport Sources Runoff Erosion Leaching Tile flow Subsurface flow Water Body Hydrology
2.4 1.6 0.8 0 400 600 800 200 0 Soil Test vs P Loss - with applied P For all data points R2=0.40 P loss, lb P2O5/A 75 kg P/ha TSP 112 kg P/ha swine slurry 150 kg P/ha poultry manure Soil Only R2=0.80 Mehlich-3 soil P, mg/kg Sharpley, USDA-ARS
Phosphorus Index • P Source Site Characteristics • Environmental Soil Test P • Same soil test different interpretation • Sampling Questions? • P Saturation? • P Fertilizer • Rate and Appl. Method • Organic P • Rate and Appl. Method • P Source Coefficient (PSC) • Direct availability of manure P to runoff • Based on WEP in manure
N P K Managing Phosphorus Pollution Transport Sources Runoff Erosion Leaching Tile flow Subsurface flow Water Body Hydrology
6 - 4 Total P mg/L Conventional till wheat - 2 Converted to no-till 0 1980 1985 1990 1995 Erosion reduced 95% Sharpley, USDA-ARS Phosphorus Transport by Erosion
N P K Managing Phosphorus Pollution Transport Sources Runoff Erosion Leaching Tile flow Subsurface flow Water Body Hydrology
Zone of Interaction with Runoff Mehlich 1 P (mg/kg) • Location of applied P • Interaction with runoff • P on surface • Soil test at surface • High P Saturation at surface Psat = P / Al + FeOxalate extr. or Mehlich 3 extr. 0 100 200 300 400 500 600 0 20 40 Depth (cm) Zone of interaction with runoff Plow depth 60 80 Data from Mozaffari and Sims, 1994 100
1980 1985 1990 1995 Soluble P Transport in Runoff 1.0 Algal-available P, mg/L Converted to no-till 0.5 0 Conventional till wheat Sharpley, USDA-ARS
N P K Managing Phosphorus Pollution Transport Sources Runoff Erosion Leaching Tile flow Subsurface flow Water Body Hydrology
Soluble P Loss by Sub-surface flow Very Dependent on soil properties • Hydrology • Piston flow • Macro pores • Texture • Soil Chemistry(Fe, Al, Ca) • P loading/saturation • Artificial Drainage Data from: Bolton et al., 1970 Culley and Bolton, 1983
N P K P Loss is a Complex “Landscape” Process Transport Sources Runoff Erosion Leaching Tile flow Subsurface flow Water Body Hydrology
Distance Runoff Return Period Landscape Transport Hydrology Modified Connectivity: Direct Connection Modified Connectivity: Riparian Buffer
Erosion Runoff Phosphorus Index • P Transport Site Characteristics • Soil Erosion • Runoff Class • Leaching Potential • Sub-surface Drainage • Contributing Distance • Modified Connectivity Drainage Distance
PA Phosphorus Index v 2.0
1.2 0.8 0.4 0 100 150 200 50 0 P Index describes P loss potential High Low Medium Very high P loss, kg/ha 75 kg P/ha TSP 112 kg P/ha swine slurry 150 kg P/ha poultry manure R2=0.79 P index value for the site Sharpley, USDA-ARS
Phosphorus Index • Low P Index • N Based Management • Medium P Index • N Based Management • High P Index* • P Based: Crop removal • Very High P Index* • No P: Manure or Fertilizer • High and Very High* • Modify Management based on P • No or reduced manure • Change time or method of application • Conservation practices • Buffers • Etc.
P2O5 P2O5 K2O K2O Phosphorus Nutrient Management Plan • Develop N based plan • Usually means excess P will be applied • Use P Index to evaluate the N based plan • Is the risk of P loss acceptable • Acceptable risk • Apply @ N rate, excess P • Unacceptable Risk • Modify N based plan, where necessary, to address P loss risk Nitrogen Based Corn/Dairy Manure or N Phosphorus Based Corn/Dairy Manure or N NONE
P Index Application • Eventually, all fields will have a high P index • P Index is not the solution • Tool to buy time to solve problem • Minimizes negative impact of P while we come up with a sustainable solution • We need to get the system into better balance
NRCS/EPA P Index Issues • Proposed change in NRCS 590 Std. • P soil test only – No more P Index • Easy to regulate • Very strict limits • Not supported by the science - Source/Transport • Unrealistic for animal agriculture to comply with in short term • Better soil P balance is a good long term goal • Withdrawn, under further review
College of Agricultural Sciences Department of Crop and Soil Sciences