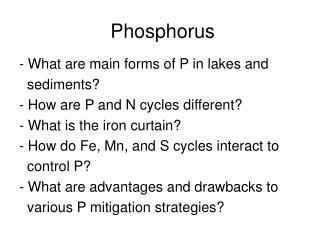
Phosphorus
2011. Lake Closure. 2008. Treatment. Algal Bloom. 1973. 1927. Waste Disposal Pond. Copper Smelter. 1905.

Phosphorus
E N D
Presentation Transcript
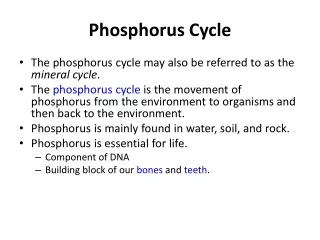
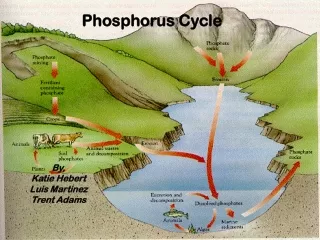
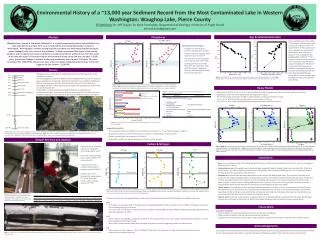
2011 Lake Closure 2008 Treatment Algal Bloom 1973 1927 Waste Disposal Pond Copper Smelter 1905 Environmental History of a ~13,000 year Sediment Record from the Most Contaminated Lake in Western Washington: Waughop Lake, Pierce CountyElli McKinley, Dr. Jeff Tepper, Dr. KenaFox-Dobbs, Department of Geology, University of Puget Soundelli.mckinley@gmail.com 1890 Lead Smelter Insane Asylum of Washington 1870 1849 Fort Steilacoom 7,700 BP Eruption of Mount Mazama Heavy Metals Age & Sedimentation Rate • Heavy metals such as Cu, Zn, Pb, and As were emitted from the Commencement Bay smelting operation as airborne byproducts, which were then deposited in the Puget Sound region. • The smelter began production in 1890 as a lead smelter, and then converted to copper. • Cu, Pb, As, Zn, and Mn all show a large spike in concentration at 113 cm • Cu, Zn, Pb, Fe, Mn remain significantly above background levels, while As decreases Eleven samples were dated using 210Pb to obtain sedimentation rates and ages of sediment within the upper 100 cm. 210Pb samples were sent to MyCore Inc. and the CRS method was used, where the decay of Pb to its daughter and granddaughter products. 210Pb is found naturally in the environment and is frequently used for dating purposes in lake cores because of its short half life (22 years). In addition to radiogenic dating, we also have three features from the core which constrain the age below 100 cm– heavy metals spike, Mazama ash layer, and sediment type change. Abstract 13,000 BP Recession of ice sheet • Concentration and Loading • Phosphorus concentration increases abruptly around 1900 • Timing of increase suggests local dairy farm was source of P • The dairy farm used the lake for waste disposal from 1927-1965. • Loading continues to increase from after dairy operation ends until the present, suggesting there are additional present-day external source(s) of P. Waughop Lake, located in Lakewood, Washington, is currently experiencing severe eutrophication and toxic algal blooms that have led it to be considered the most contaminated lake in western Washington. Anthropogenic nutrient loading over the past century (animal waste disposal and septic system leakage) is the main cause of the problems. To better understand the origins of the current problems and the options for future remediation we collected a 655 cm sediment core from the center of the lake with a goal of reconstructing the environmental history of the lake over the past ~13,000 years, focusing on changes in nutrient loading and productivity over the past ~150 years. Our core penetrated the 7700 BP Mt. Mazama ash layer at 413 cm depth; extrapolating to the base of the core suggests the lake formed ~13,000 BP. History Sample Retrieval and Analysis Figure 7. Left. Depth in the core expressed per year where depth per year declines steadily until 1940. Right. Sedimentation rate expressed per year. Sedimentation rate increases by over 4000 g/m2/year over 112 years. Waughop Lake is a kettle lake formed following retreat of the Puget Lobe of the Cordilleran Ice Sheet. Two anthropogenic activities in particular have impacted the lake over the past 150 years: agriculture and smelting. Nearby Fort Steilacoom was initially established in 1849 as a military base, but later purchased to become the Insane Asylum of Washington Territory, where patients grazed cattle, and subsequently used the lake as a waste disposal site. In the 1890’s a smelter operated by ASARCO facility was established at Commencement Bay. Over the next 90 years processing of As-rich Pb and Cu ores resulted in deposition heavy metals via particulate matter throughout the region. • Eight sections of core were collected in September 2012 using a piston corer. • Two small outboard motor boats used as platform for core extraction. • A duplicate core was collected to be used for dating purposes (Table 1). • Samples were then analyzed for heavy metals, P, Cand N elemental levels, C and N isotopic values, and 210Pb. Figure 4. Left.Phosphorus concentration versus depth. Background levels are present till ~1900, and abruptly increase. Right. Phosphorus loading versus depth. P appears to increase in loading before ~1920, and increases constantly until present. Blue shaded area indicates the time period the adjacent dairy farm was in operation. 1900 1900 Waughop Lake 7,700 BP: Mazama ash 7,700 BP: Mazama ash 1980 1980 1980 Figure 5. Percent of total P in each depth interval. Two samples 114 A and 114 B were ran as duplicates. Lake Louise • Sequential extraction • This sequential extraction method is used to extract various forms of P (e.g., labile, inorganic, organic) • Proportions of loosely sorbed, Fe-bound, and and Ca-P + apatite (Step I-III) are invariant • Deeper samples show less proportions of Step IV • Fe-bound P contains the highest proportion of P among four samples 1889 Figure 1. Left. A time line of the anthropogenic history around WaughopLake beginning 13,000 BP until present. Center. Area map showing a region of the Tacoma peninsula. The orange circle locates Waughop Lake (Googlemaps).Right. Study site. The lake is located in Fort Steilacoom Park in Lakewood, Washington. The eutrophic state of the Lake in 2011 is even noticeable in satellite imagery, visible here is the greenish color. (Google Earth). 1889 1889 • Twenty-two carbon and nitrogen isotopic samples were analyzed at University of California Santa Cruz Stable Isotope Lab. • δ15N • δ15N values are relatively uniform through much of the geologic history of lake. At about 153 cm (~1890), δ15N values increase by 5‰,indicating the input of manure. • This is increase in δ15N values is linked to the Insane Asylum of Washington Territory (Western State Hospital) and development of their dairy operation in 1870. • δ13C • Below ~500 cm (~10,500 BP), a negative excursion in δ13C values by 9‰occurs. This is likely correlated to the influence of a short term climatic event (Younger Dryas). • Above 1900, carbon isotope values become higher and more consistent suggesting a uniform carbon source. • C:N • Ratios remain constant (approx. 11) after 8,000 BP. These ratios are indicative of a high contribution of aquatic primary productivity to sediment organics. Conclusions • Ages were constrained using 210Pb dating, the basalt silt layer at 638 cm, Mount Mazama Ash layer at ~413 cm, and spike in heavy metals at ~80 cm. • Sedimentation rate at Waughop Lake is extremely high, exceeding those of adjacent Lake Louise by about 50x. At the turn of the century, the sedimentation rate was about 1000 g/m2/yr, and increased to 6000 g/m2/yr. This increase is linked to the high proportion of organics in the sediment. • Phosphoruswithin the lake increases dramatically at 93 cm by 6x the background levels. This increase is believed to be caused by the usage of Waughop Lake as a waste disposal pond for the Western State Hospital dairy operation. P loading in the lake increases at 86 cm and continues to increase loading up to present. This continued loading of P indicates that there is either another source of P being added to the lake, currently, and or the P is being recycles with lake turnover. P sequential extraction reveals that the the dominant pool with depth is an Fe-bound phase. • Heavy metals in the sediment remain at background concentration until ~80 cm where concentrations increase by up to 50x (Pb) and 5x (Cu). This increase is connected to the establishment of a smelter in Commencement Bay in 1890 where byproducts of the smelting are released into the atmosphere and collected in the lake. Ultimately the concentrations are low enough that the sediment is not considered hazardous waste. • Organic input to the lake is derived from a higher proportion of aquatic material as seen with the C:N value. The Nitrogen isotope value increases by 5‰ at 68 cm, which marks when Waughop Lake was used as a waste disposal pond. Carbon & Nitrogen Figure 8.Right. Arsenic concentration versus depth. As concentrations increase at 103 cm, dated to 1900. Concentrations begin to decline around 50 cm. These two dates correspond to dates of smelting operation. Center. Iron loading versus depth. Fe loading begins to increase around 50 cm, until present. Left. Copper and Lead versus depth. This trend shown, is also seen in Zn concentrations where these metals increase around 1889, and remain high through present. Green shading highlight dates of smelter operation. Phosphorus Future Work • Questions remaining: • Diatom analysis to understand paleoproductivity over the past 13,000 year • Pollen analysis to better constrain paleoenvironmental conditions • Geochemical analysis of other metals, such as Mo, to better understand the mobility of metals in the sediment column Figure 6. Left. Nitrogen isotope value versus depth. Nitrogen isotopes can be used as a proxy for environmental contamination in freshwater ecosystems. Center. Carbon isotope value versus depth. Carbon isotope are used as both a general climate proxy. Right. The ratio of carbon to nitrogen versus depth. C:N ratio can be used to infer vegetation source over time. Mount Mazama ash layer is found at 413 cm, 7,700 years BP. Figure 2. Each segment of core was extruded into PVC piping (left). Small outboard motor boats were used as a platform for core extraction, where metal rods are used to push piston corer to known depth (right). Table 1. Depth intervals of individual cores Acknowledgements This project was funded by the University Enrichment Committee and the Geology Department, both at the University of Puget Sound. Fellow Puget Sound students, Lisa Kant and Spencer Sheridan, assisted in the collection of the sediment core. Table 2. A modified sequential extraction method for different P forms, as determined by Ruttenberg (1992). Figure 3. View of Drive 5 showing the Mount Mazama ash layer at 413cm. The eruption of Mount Mazama deposited a layer of ash around the Pacific Northwestabout 7,700 years ago.