Download
1 / 40
460 likes | 775 Views
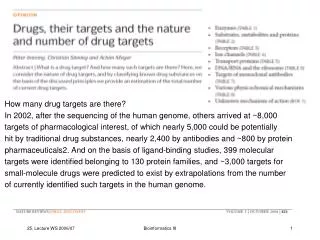
How many drug targets are there? In 2002, after the sequencing of the human genome, others arrived at ~8,000 targets of pharmacological interest, of which nearly 5,000 could be potentially hit by traditional drug substances, nearly 2,400 by antibodies and ~800 by protein

E N D
How many drug targets are there? In 2002, after the sequencing of the human genome, others arrived at ~8,000 targets of pharmacological interest, of which nearly 5,000 could be potentially hit by traditional drug substances, nearly 2,400 by antibodies and ~800 by protein pharmaceuticals2. And on the basis of ligand-binding studies, 399 molecular targets were identified belonging to 130 protein families, and ~3,000 targets for small-molecule drugs were predicted to exist by extrapolations from the number of currently identified such targets in the human genome. Bioinformatics III
Drug Target: Enzymes Bioinformatics III
Drug Target: Enzymes II Bioinformatics III
Drug Target: Enzymes III Bioinformatics III
Drug Target: Enzymes III Bioinformatics III
Drug Target: Receptors I Bioinformatics III
Drug Target: Receptors II Bioinformatics III
Drug Target: Receptors III Bioinformatics III
Drug Target: Receptors III Bioinformatics III
Drug Target: Ion channels Bioinformatics III
Drug Target: Transport proteins Bioinformatics III
Drug Target: DNA/RNA and the ribosome Bioinformatics III
Drug Target: Targets of monoclonal antibodies Bioinformatics III
Drug Target: Various physicochemical mechanisms Bioinformatics III
Outlook A large part of this paper is concerned with the nature of drug targets and the need to consider the dynamics of the drug–targets (plural intended) interactions, as these considerations were used to define what we would eventually count. Many successful drugs have emerged from the simplistic ‘one drug, one target, one disease’ approach that continues to dominate pharmaceutical thinking, and we have generally used this approach when counting targets here. However, there is an increasing readiness to challenge this paradigm. We have discussed its constraints and limitations in light of the emerging network view of targets. The recent progress made in our understanding of biochemical pathways and their interaction with drugs is impressive. However, it may be that ‘the more you know, the harder it gets’. It is not the final number of targets we counted that is the most important aspect of this Perspective; rather, we stress how considerations about what to count can help us gauge the scope and limitations of our understanding of molecular reaction partners of active pharmaceutical ingredients. Targets are highly sophisticated, delicate regulatory pathways and feedback loops but, at present, we are still mainly designing drugs that can single out and, as we tellingly say, ‘hit’ certain biochemical units — the simple definable, identifiable targets as described here. This is not as much as we might have hoped for, but in keeping with the saying of one of earliest medical practitioners, Hippocrates: “Life is short, and art long; the crisis fleeting; experience perilous, and decision difficult.” Humility remains important in medical pharmaceutical sciences and practice. Bioinformatics III
Specific example: protein kinases Phosphorylation of serine, threonine, and tyrosine residues is a primary mechanism for regulating protein function in eukaryotic cells. Protein kinases, the enzymes that catalyze these reactions, regulate essentially all cellular processes and have thus emerged as therapeutic targets for many human diseases. Small-molecule inhibitors of the Abelson tyrosine kinase (Abl) and the epidermal growth factor receptor (EGFR) have been developed into clinically useful anticancer drugs. Selective inhibitors can also increase our understanding of the cellular and organismal roles of protein kinases. However, nearly all kinase inhibitors target the adenosine triphosphate (ATP) binding site, which is well conserved even among distantly related kinase domains. For this reason, rational design of inhibitors that selectively target even a subset of the 491 related human kinase domains continues to be a daunting challenge. Cohen et al. Science 308, 1318 (2005) Bioinformatics III
Specific example: protein kinases Structural and mutagenesis studies have revealed key determinants of kinase inhibitor selectivity, including a widely exploited filter in the ATP binding site known as the „gatekeeper“. A compact gatekeeper (such as threonine) allows bulky aromatic substituents, such as those found in the Src family kinase inhibitors, PP1 and PP2, to enter a deep hydrophobic pocket. In contrast, larger gatekeepers (methionine, leucine, isoleucine, or phenylalanine) restrict access to this pocket. A small gatekeeper provides only partial discrimination between kinase active sites, however, as ca. 20% of human kinases have a threonine at this position. Gleevec, a drug used to treat chronic myelogenous leukemia, exploits a threonine gatekeeper in the Abl kinase domain, yet it also potently inhibits the distantly related tyrosine kinase, c-KIT, as well as the platelet-derived growth factor receptor (PDGFR). Bioinformatics III
Selection of gatekeeper residue Bioinformatics III
Outlook In this study, we have rationally designed halomethylketone-substituted inhibitors whose molecular recognition by protein kinases requires the simultaneous presence of two selectivity filters: a cysteine following the glycine-rich loop and a threonine in the gatekeeper position. We estimate that ca. 20% of human kinases have a solvent-exposed cysteine in the ATP pocket. Because of the structural conservation of the pocket, it should be possible to predict the orientation of these cysteines. In addition, there are many reversible kinase inhibitors whose binding modes have been characterized by x-ray crystallography. The integration of both types of information should allow the design of scaffolds that exploit selectivity filters other than the gatekeeper, as well as the appropriate sites for attaching electrophilic substituents. Bioinformatics III
Small molecule-kinase interaction map Figure 1.Competition binding assay for measuring the interaction between unlinked, unmodified ('free') small molecules and kinases.(a) Schematic overview of the assay. The phage-tagged kinase is shown in blue, 'free' test compound in green and immobilized 'bait' ligand in red. (b) Binding assay for p38 MAP kinase. The immobilized ligand was biotinylated SB202190. The final concentration of test compounds during the binding reaction was 10 M. (c) Determination of quantitative binding constants. Binding of tagged p38 to immobilized SB202190 was measured as a function of unlinked test compound concentration. Tagged p38 kinase was quantified by real-time quantitative PCR and the results normalized. Fabian et al. Nature Biotech 23, 329 (2005) Bioinformatics III
Small molecule-kinase interaction map Bioinformatics III
Small molecule-kinase interaction map Each kinase represented in the assay panel is marked with a red circle. Gene symbols for kinases in the panel are shown in Figure 5. TK, nonreceptor tyrosine kinases; RTK, receptor tyrosine kinases; TKL, tyrosine kinase-like kinases; CK, casein kinase family; PKA, protein kinase A family; CAMK, calcium/calmodulin dependent kinases; CDK, cyclin dependent kinases; MAPK, mitogen-activated protein kinases; CLK, CDK-like kinases. Bioinformatics III
Small molecule-kinase interaction map Figure 3.Specificity profiles of clinical kinase inhibitors. Circle size is proportional to binding affinity (on a log10 scale). Binding constants were measured at least in duplicate for each interaction identified in the primary screen. Bioinformatics III
Distribution of binding constants For each compound the pKd (-log Kd) was plotted for all targets identified. Primary targets, as shown in Table 1, are in blue, and off-targets in red. Staurosporine does not have a particular primary target or targets, and the primary targets for BAY-43-9006 (RAF1) and LY-333531 (PKC ) were not part of the assay panel. Bioinformatics III
Hierarchical cluster analysis of specificity profiles Lighter colors correspond to tighter interactions. (a) Twenty kinase inhibitors profiled against a panel of 113 different kinases. Bioinformatics III
Small molecule-kinase interaction map We have described a systematic small molecule−kinase interaction map for clinical kinase inhibitors. Integration of the information provided here with results from cell-based or animal studies, and ultimately with clinical observations, should enable a more complete understanding of the biological consequences of inhibiting particular combinations of kinases. Binding profiles for larger numbers of chemically diverse compounds, combined with the phenotypes elicited by these compounds in biological systems, will help identify kinases whose inhibition leads to adverse effects, kinases that are 'safe' to inhibit and combinations of kinases whose inhibition can have a synergistic beneficial effect in particular disease states. This knowledge should enable the development of inhibitors with 'appropriate' specificity that target multiple kinases involved in the disease process while avoiding kinases implicated in side effects. The ability to rapidly screen compounds against multiple kinases in parallel and the incorporation of specificity profiling during initial lead discovery and optimization should greatly facilitate and accelerate the drug development process. Bioinformatics III
Small molecule-kinase interaction map The kinase binding profiles also provide valuable information to guide structural studies. In many cases kinases that tightly bind the same compound have no obvious sequence similarity (for example, p38 and ABL(T315I) binding to BIRB-796). In other cases, compounds can discriminate between kinases closely related by sequence, such as imatinib binding to LCK but not SRC. ABL and the imatinib-resistant ABL mutants are of particular structural interest because some compounds bind with good affinity to all forms (e.g., ZD-6474), whereas BIRB-796 has a strong preference for a particular mutant. Key insights should result from an analysis of selected co-crystal structures of kinase-compound combinations identified through profiling studies, and the large, uniform data set presented here should serve as a valuable training set for computation-based inhibitor design. Finally, the use of phage-tagged proteins in quantitative biochemical assays circumvents the need for conventional protein production and purification, and should help reduce one of the major bottlenecks in modern proteomics and drug discovery research. Bioinformatics III
Multidrug treatments are increasingly important in medicine and for probing biological systems. But little is known about the system properties of a full drug interaction network. Epistasis among mutations provides a basis for analysis of gene function. Similarly, interactions among multiple drugs provide a means to understand their mechanism of action. Aim: derive a pairwise drug interaction network. Yeh et al. Nature Genetics 38, 489 (2006) Bioinformatics III
Different ways of drug interaction Clustering of individual drugs into functional classes solely on the basis of properties of their mutual interaction network. Schematic illustration of additive, synergistic and antagonistic interactions between drugs X and Y by measurements of bacterial growth under the following conditions: no drugs, drug X only, drug Y only, and both drugs X and Y. Additive: no interaction Synergistic: larger-than-additive effect Antagonistic: smaller-than-additive effect Bioinformatics III
Classification of drug interactions g , gX, gXY : growth of wild-type, with drug X, and with drugs X and Y This scale maps synthetic lethal interactions to = -1, additive interactions are mapped to = 0, antagonistic buffering to = 1, and antagonistic suppression to > 1. Bioinformatics III
The Prism algorithm Bioinformatics III
Classification (b–d) A network (b) of synergistic interactions (red lines) and antagonistic interactions (green lines) between drugs (black circles) can be clustered into functional classes that interact with each other monochromatically (that is, with purely synergistic or purely antagonistic interactions between any two classes; c). This classification generates a system-level perspective of the drug network (d). (e,f) Two independent observations indicate whether a new drug (Z) will be clustered into a particular drug class (a, dashed oval): mixed synergistic and antagonistic intraclass interactions of Z with a (e, thin dotted green and red lines) and nonconflicting interclass interactions of Z (e, dotted thin lines) and a (e, dotted thick lines) with all other classes. Both intra and interclass indications are depicted in e, and the drug is clustered (black arrow) with an existing class. If drug Z has no such intra- or interclass association with any existing drug class, the drug will be clustered in a new class (f). Bioinformatics III
Tested drugs Bioinformatics III
Experimental classification of drug interaction Figure 2 Experimental classification of drug interactions into four types using bioluminescence measurements of bacterial growth in the presence of sublethal concentrations of antibiotics. (a) The pairs of antibiotics illustrate synergistic interactions. The number of bacteria (proportional to bioluminescence counts per second (c.p.s.) is shown from two replicates, for control with no drugs (f, solid black lines), each single drug (X, Y; blue and magenta lines) and the double-drug combination (X + Y, dashed black lines). Insets: normalized growth rates (W) with error bars for f, X, Y and X+Y, from left to right, respectively. Note the contrast between the interactions of piperacillin with the 50S ribosomal subunit drug erythromycin (a, ERY-PIP, synergistic) and the 30S ribosomal subunit drug tetracycline (c, TET-PIP, antagonistic). Bioinformatics III
Different modes of interaction The pairs of antibiotics illustrate synergistic (a), additive (b), antagonistic buffering (c) and antagonistic suppression (d) interactions Bioinformatics III
Systematic measurements of pairwise interactions between antibiotics (a) Growth measurements and classification of interaction for all pairwise combinations of drugs X and Y. Within each panel, the bars represent measured growth rates for, from left to right: no drugs (f), drug X only, drug Y only and the combination of the two drugs X and Y (see inset). Error bars represent variability in replicate measurements. The background color of each graph designates the form of epistasis according to the scale in b: synergistic (red: emax < -0.5; pink: -0.5 < emax < -0.25), antagonistic buffering (green: 0.5 < emin < 1.15; light green: 0.25 < emin < 0.5), antagonistic suppression (blue: emin > 1.15) or additive (white: -0.25 < emax < 0.5 and -0.5 < emin < 0.25). Cases that do not fall into any of these categories are labeled inconclusive (gray background). Bioinformatics III
Classification into interaction classes Unsupervised classification of the antibiotic network into monochromatically interacting classes of drugs with similar mechanisms of action. (a) The unclustered network of drug-drug interactions with synergistic (red), antagonistic buffering (green) and antagonistic suppression (blue) links. Bioinformatics III
Monochromatically interacting functional classes (b) Prism algorithm classification of drugs into monochromatically interacting functional classes. This unsupervised clustering shows good agreement with known functional mechanism of the drugs (single letter inside each node; see Table 1). Bleomycin (BLM), which is believed to affect DNA synthesis, although its mechanism is not well understood, cannot be clustered monochromatically with any other class. The multifunctional drug nitrofurantoin (NIT) shows non-monochromatic interactions. Bioinformatics III
System-level interactions between the drug classes (c) Larger ellipses show higher-level classification of DNA gyrase inhibitors (D) with inhibitors of biosynthesis of DNA precursors (F) and classification of the two subclasses of drugs involved in the inhibition of protein synthesis via the 50S ribosomal subunit (R). Bioinformatics III
Outlook We provide a complete and systematic analysis of a drug-drug interaction network. Systems analysis of the interaction network demonstrates that drugs can be classified according to their action mechanism based on their interactions with other functional drug classes. The ability to classify drug function based solely on phenotypic measurements and without the tools of biochemistry or microscopy can provide a simple and powerful method for screening new drugs with multiple or novel mechanisms of action. Our systems approach is general in nature and could be applied to other biological systems. It would be particularly useful if the approach could be generalized to in vivo studies and to a wider range of phenotypes despite added complexity of host-drug interaction. Furthermore, applying network approaches to drug interactions may help suggest new drug combinations and highlight the importance of gene-environment interactions, including, in particular, the resistance and persistence of bacteria to antibiotics and of cancer cells to antitumor drugs. Bioinformatics III