Download
1 / 29
290 likes | 490 Views
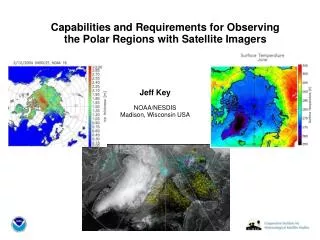
Capabilities and Requirements for Observing the Polar Regions with Satellite Imagers. Jeff Key NOAA/NESDIS Madison, Wisconsin USA. Arctic Products from Polar Orbiters: A Brief Survey. Imagers (optical and microwave): Winds Cloud cover, thickness, particle size, phase, height

E N D
Capabilities and Requirements for Observing the Polar Regions with Satellite Imagers Jeff KeyNOAA/NESDISMadison, Wisconsin USA
Arctic Products from Polar Orbiters: A Brief Survey • Imagers (optical and microwave): • Winds • Cloud cover, thickness, particle size, phase, height • Low-level inversions • Radiation (surface and TOA) • Fires, volcanic ash • Surface temperature and albedo • Ice concentration, extent, motion, thickness/age • Snow cover, particle size • Radiation, surface and TOA • Sounders: • Temperature and moisture profiles • Heat and moisture advection • Other: • Cloud properties (lidar and radar) • Surface elevation (lidar)
Polar Winds – AVHRR and MODIS MODIS: bent-pipe, Terra & Aqua separately and combined; MODIS direct broadcast; AVHRR: GAC, HRPT, NOAA & MetOp (with EUMETSAT); historical GAC
AIRS Polar Winds in Radiance vs Retrieval Space Radiance space: Feature-tracked winds from MODIS (left) and AIRS (right) water vapor imagery Retrieval space: Since the spectral and vertical resolution of AIRS is much higher than MODIS, we can attempt to employ retrieved moisture fields for the winds tracking, thereby avoiding the ambiguity of the vector height. Additionally, winds from many distinct vertical levels can be resolved. Left: AIRS moisture retrieval targets (cyan) and wind vectors (yellow barbs) at 400hPa. (Courtesy C. Velden)
GOES-10 sub-point water vapor Antarctica CO2 • Water vapor and CO2 bands improve retrievals of: • temperature and moisture profiles, including inversions, • cloud properties and height assignment • winds (Courtesy of D. Tobin)
Low-Level Atmospheric Temperature Inversions from MODIS Strength (C) Depth (m) January July
Extended AVHRR Polar Pathfinder (APP-x), 1982-2004 Cloud Forcing, Autumn
Recent Trends Winter Surface Temperature Trend: APP-x (Courtesy R. Stone)
Heat and Moisture Advection from TOVS Path-P Decadal trends in poleward advective heating in layer between 500 and 300 hPa (K/day/decade) for each season. (Courtesy of J. Francis)
The A-train: Aqua, CloudSat (cloud radar), CALIPSO (cloud-aerosol lidar), Parasol (polarized, multiangle), and Aura (chemistry). Satellites fly in formation within minutes of each other. CLOUDSAT & CALIPSO (Courtesy T. Vonder Haar)
Ice Concentration/Extent from MODIS, AMSR-E Sea ice concentration (SIC) (%) retrieved from (a) MODIS Sea Ice Temperature (SIT), (b) MODIS visible band reflectance, and (c) from Advanced Microwave Scanning Radiometer - Earth Observing System (AMSR-E) Level-3 gridded daily mean from NSIDC on March 31st, 2006. MODIS retrievals compare well with AMSR-E retrievals, and show more detailed information.
MODIS Aqua true color image (left) on March 31, 2006 over Kara Sea, and derived surface skin temperature in Kelvin degree (middle), and ice concentration in percentage (right). Ice Surface Temperature from MODIS, AVHRR
Ice Motion from MODIS • Data taken from May 4-9, 2008 from MODIS Direct Broadcast site at Tromsø, Norway • Test case below from May 8, 2008. Daily composite of all ice motion vectors and 11 micron brightness temperatures, taken from TERRA. • Data has an average of around 1 m/s difference in speed and 20 degrees difference in direction compared to drifting ice buoys.
Ice Thickness from MODIS, AVHRR Estimated ice thickness (left) and ice age (right) based on AVHRR data on March 12, 2004 at 04:00 LST for the entire Arctic region under all-sky condition. Right: Comparison of satellite-derived thickness and ice draft from submarine sonar.
Snow Cover from MODIS (Courtesy of D. Hall) from Blended MODIS and SSM/I (Courtesy of NSIDC)
During minimum extent: Extent trend: -8.2 %/decade Area trend: -9.8%/decade Arctic Ice Cover from Nimbus-7 SMMR and DMSP SSM/I (Courtesy of J. Comiso)
2007 Arctic Sea Ice Extent Record Minimum Captured by CSA RADARSAT-1 The Alaska Satellite Facility (ASF) downlinks and mosaics Canadian Space Agency (CSA) RADARSAT-1 images of the western Arctic Ocean every three days. These synthetic aperture radar (SAR) images are acquired both day and night regardless of weather conditions. The data are used for research and operational monitoring of changes in sea ice cover. The National Ice Center (NIC) provides the Alaska Region with synthetic aperture radar (SAR) imagery and experimental derived products for safety of fisheries, marine transportation, and low-flying aircraft .
GLAS is both a surface laser ranging system and an atmospheric profiling lidar.
Product Requirements (from multiple sources; open to discussion)
How do we meet the time requirements? A single polar orbiter will cover very high latitudes every 100 minutes, but with a large gap each 24 hr period (depending on the scan angle cutoff). Two or more polar orbiters will improve the coverage (iridium: 66 satellites!). Of course, only part of the Arctic is covered at any given time. However, combining multiple satellites into a single data stream can be complicated because of parallax and inter-satellite calibration differences.
24 hr Coverage, One and Two Satellites Terra only Terra and Aqua (separately)
On the Use of Geostationary Satellites at High Latitudes Geostationary satellites offer excellent temporal coverage and complete spatial coverage at every time step. But can they be used at high latitudes?
GEO Satellites: Issues There are, however, issues at higher latitudes, particularly in terms of pixel size and atmospheric path length and the impact they have on retrievals. Theoretical pixel size change with LZA (for a 2 km FOV) Brightness temperature changes with local zenith angle (LZA) for various channels.
GEO Satellites: Impacts on Motion Products The lower limit for tracking moving objects (clouds, water vapor, ice) is a function of temporal sampling interval and spatial resolution.
GEO Satellites: Impacts on Coverage Products Binary labeling (e.g., cloud/not-cloud) is strongly dependent upon the pixel size. Using the beta distribution to describe the distribution of subpixel area fraction, we see that the distributions vary considerably as a function of pixel size (represented here by the variance). This generally results in an overestimation of total area fraction. This overestimation is much less of a problem if subpixel area fraction is the goal rather than binary labeling.
GEO Satellites: Impacts on Profiles There is a degradation on the water vapor retrievals but little impact on temperature retrievals. Large local zenith angles result in a more nonlinear relationship for water vapor retrieval. Temperature (above) and moisture (right) profile retrieval RMSE for different LZAs using simulated hyperspectral IR data.
Molniya iridium New Satellite System Possibilities Medium Earth Orbits Winds coverage with geos and MODIS Winds coverage with geos and Molniya
Some snow and ice parameters do not need to be monitored at high temporal frequencies. Observations from polar orbiters are sufficient. Other paramgers, particularly atmospheric, would benefit from more frequent temporal sampling. • Geostationary satellites provide excellent temporal coverage, but large view angles and path lengths makes them usable only to about 60o latitude. • Multiple polar orbiters provide better temporal and spatial coverage, but constantly changing viewing geometry and inter-satellite calibration differences complicates this approach. • Is it time for a new type of satellite observing system? Maybe it is. Conclusions