Download
1 / 5
50 likes | 75 Views
Explore motion through creating a distance vs. time graph by walking and jogging at different speeds. Analyze the graph to determine if there was constant acceleration. This lab activity will enhance your understanding of physics.

E N D
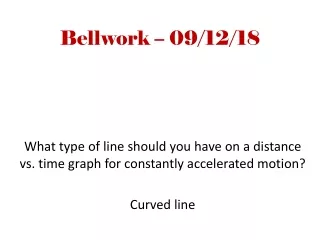
Bellwork – 09/12/18 What type of line should you have on a distance vs. time graph for constantly accelerated motion? Curved line
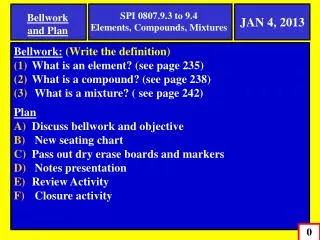
H Physical Science Motion Lab
Lab Objective • To generate a distance vs. time graph based on your own movement. This graph [ as well as the Analysis/Conclusion ] will be counted as a lab grade.
Procedure • 10 m sections are marked in CN2. • With a partner, find the time it takes for you to walk that 10 m. [Try for constant speed in that section.] Record data. • Then, walk or jog the 2nd 10 m section a little faster. • Repeat for final three 10 m. Total distance will be 50 m. • Repeat for other partner / team member.
Conclusions / Analysis • Create Graph for Distance vs. Time • Make sure you provide a title, axes labels and such components of a proper graph covered earlier in the 1st Q • Raw data and data used for graph should be included ( columns properly labelled with a title ) • Conclusion • 1 paragraph [ 5+ sentences ] describing your results: Does your graph indicate constant acceleration? Why or why not?