
Predicting Oxygen Saturation from Respiration Data for Sleep Apnea Detection
This study presents a dynamic model to predict blood oxygen saturation (SpO2) using respiration signals, offering potential for automated sleep apnea detection. The method utilizes the integral of airflow magnitude entering the lungs, which influences blood oxygen levels via standard respiratory processes. Results show that the model reliably estimates SpO2 solely from respiration data, enabling efficient detection of sleep apnea without the need for costly overnight polysomnography. This innovative approach aims to improve accessibility to sleep apnea diagnosis and monitoring.

Predicting Oxygen Saturation from Respiration Data for Sleep Apnea Detection
E N D
Presentation Transcript
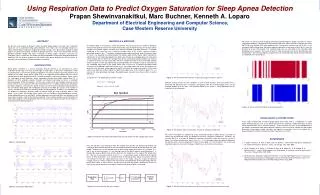
Using Respiration Data to Predict Oxygen Saturation for Sleep Apnea DetectionPrapanShewinvanakitkul, Marc Buchner, Kenneth A. Loparo Department of Electrical Engineering and Computer Science, Case Western Reserve University ABSTRACT We present and evaluate a dynamic model to predict blood oxygen saturation from respiration signals for use in automated sleep apnea detection. The model uses the averaged integral of a signal representing the respiration magnitude entering the lungs. This signal affects changes in blood oxygen saturation level through standard respiration processes. The results demonstrate that the approach provides reliable and robust estimation of blood oxygen saturation using only the respiration signal. Furthermore, the model may be incorporated in automated sleep apnea detection algorithms that can lead to inexpensive and reliable sleep apnea detection that do not require an overnight stay in the hospital for polysomnogram recordings. INTRODUCTION Sleep apnea syndrome is a serious respiratory disorder defined as an interruption of normal respiration during sleep. The most common type of sleep apnea is obstructive sleep apnea (OSA) characterized by a transient but repetitive reduction or cessation of airflow caused by partial or total collapse of the upper airway during sleep. OSA is an important health problem that can lead to reduced daytime work performance and is related to accidents and health problems. Some studies link sleep apnea to atrial fibrillation, stroke, myocardial infarction and sudden cardiac death [1]. A diagnosis of OSA syndrome requires full-night multi-channel monitoring by means of overnight polysomnography (PSG) [2]. However, a PSG study is both costly and complex requiring manual human analysis to scan and score the entire sleep record. This is a tedious and time consuming task that delays diagnosis and treatment. Some research has been done to develop monitoring devices that can detect sleep apnea with comparable accuracy to the PSG but using a small number of sensors and the elimination of the need for lengthy in-lab monitoring. To address one component of this problem we develop a dynamic model to estimate SpO2 by using respiratory data in sleep apnea. In our model, we consider three signals that are available in polysomnographic records: airflow, abdominal excursion and SpO2. Airflow, abdominal excursion and SpO2 are commonly used measurement signals used to characterize breathing. These signals provide useful information for sleep apnea diagnosis and interpretation. We first illustrate these signals for both normal (Figure 1) and disturbance breathing (Figure 2). MATERIALS & METHODS To estimate SpO2 as a function of airflow, we consider the primary input to our model as being the integral of the absolute value of the airflow entering the lungs through breathing. This quantity affects changes of the blood oxygen saturation level through standard respiration processes. To provide smoothing of this signal we use a real-time average value of this airflow measure during a prescribed period of time, T. Based on fundamental physiological behavior (and illustrated in figure 2), there is an expected time delay between the airflow signal and the SpO2 signal. Experiments indicate that for the model developed here (which also includes an averaging delay) this time delay 10-15 seconds. We first define the average value of the accumulated absolute airflow over the past T seconds to reflect the recent lung input. We then smooth the value of the accumulated absolute airflow using a first order lag (representing an average delay of seconds) having an initial value of the smoothing signal equal to the actual SpO2 value at that time. To improve the global model sensitivity, we introduced a nonlinearfunction in the airflow processing “chain” that captures the idea that in the low level airflow regime the SpO2 level tends to change very quickly. On the other hand, in the high level airflow regime the SpO2 level keeps close to the maximum point. This is a result of the base physiology that keeps the blood oxygen saturation level close to 96% in normal breathing. To capture this, the following function is used: where We further use the result from the SpO2 estimation to predict drops in oxygen saturation as used in sleep apnea detection. We determine SpO2 desaturation from the baseline by using both the actual SpO2 and the estimated SpO2 from abdominal data. The baseline saturation was set to 92% as the average of SpO2 during sleep. Saturation drop was defined as a decrease of SpO2 by 3% from the baseline for at least 10 seconds. The saturation drop rate was calculated as the saturation drop divided by time in seconds. The results in figure 8show the duration over which SpO2 desaturation was detected. The estimated SpO2 can capture most of the duration from the desaturation detection as compared to the actual SpO2. Figure 5:The result from the estimation of SpO2 by using the system in figure 4. However, looking closely we find a problem in some limited situations when the airflow level is increased and decreased over a relatively short period, then the estimated SpO2 levels are not changed properly all of the time. The estimated SpO2 in our system is mainly dependent on the characteristic of airflow data. Xo Fo Figure 8:The result from the SpO2 desaturation detection. L CONCLUSIONS & FUTURE WORK In this study, we presented a model to predict SpO2 that can be used as a component in a sleep apnea detection process. The results demonstrate that the model has reliable estimation of SpO2 using respiration data and is relatively accurate. Future research will focus on the incorporation of the model in automated sleep apnea detection algorithms that can lead to inexpensive and reliable obstructive sleep apnea testing that does not require an overnight stay in the hospital for a polysomnogram but which can be performed at the patient’s home [3]. REFERENCES F. Lopez-Jimenez, F. H. Sert, A. Gami, and V. K. Somers, “Obstructive sleep apnea. Implications for cardiac and vascular disease,” Chest, vol. 133, pp. 793 – 804, 2008. W. W. Flemons, M. R. Littner, J. A. Rowlet, P. Gay, W. M. Anderson, D. W. Hudgel, R. D. McEvoy, and D. I. Loube, “Home diagnosis of sleep apnea: A systematic review of the literature,” Chest, vol. 124, pp. 1543−1579, 2003. Abraham Otero, Santiago F. Dapena, Paulo Felix, Jesus Presedo, Miguel Tarasc o, “A Low Cost Screening Test for Obstructive Sleep Apnea that can be Performed at the Patient’s Home,” 6th IEEE International Symposium on Intelligent Signal Processing, 2009. Fo - L Figure 6:The problem from the estimation of SpO2 by using the airflow data. We further investigate this problem by using measuring changes in body volume. Cessation of airflow can be observed clearly by abdominal excursion respiratory movements. Therefore, we estimate SpO2 as a function of abdominal respiratory movements again by using the system in figure 4. As before an exhaustive search in the parameter space was done to determine the optimal values of these parameters to best fit actual data. As seen in figure 7, the system can now better represent the level of changes in SpO2 closer to that of the actual values. Figure 3:Illustrates the relationship between the average airflow and the average SpO2 values. Figure 1: Normal Sleep Here the red line is the actual data from the samples that describe the relationship between the average of SpO2 and the average of the summation of (absolute valued) airflow data over the same period. The blue line is the estimated value of SpO2 using airflow data and the function. , and are all constant values. is the average value of the SpO2 signal in normal breathing, is the possible range of SpO2 value, and represents the steepness of the slope at the airflow value of . We use an exhaustive search in the parameter space to determine the optimal values of these parameters so as to find the best fit with actual data. Figure 4 illustrates how the function fits into the signal processing chain in the model. Using this model we obtained example results as shown in figure 5 that illustrate the correspondence of the model output with the actual SpO2 signal. In these results it can be seen that when the airflow is decreased, the level of SpO2 is decreased and when the airflow is increased, the level of SpO2 is increased. Estimate SpO2 Respiratory Data Figure 4:System overview with function. Figure 7:The result from the estimation of SpO2 by using the abdominal movements data. Figure 2: Obstructive Sleep Apnea


