Download
1 / 51
510 likes | 528 Views
Learn key statistics terms, formulas, counting techniques, and probability concepts to analyze data effectively. Understand how to calculate mean, median, mode, quartiles, outliers, probability, and more.

E N D
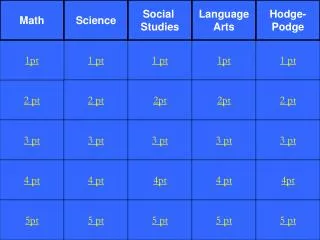
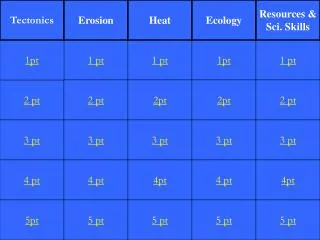
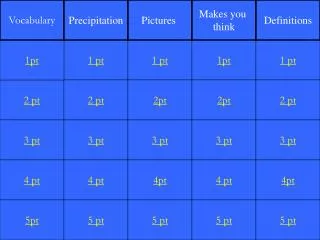
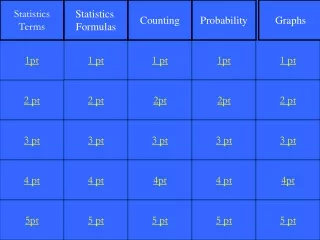
Statistics Terms Statistics Formulas Counting Probability Graphs 1pt 1 pt 1 pt 1pt 1 pt 2 pt 2 pt 2pt 2pt 2 pt 3 pt 3 pt 3 pt 3 pt 3 pt 4 pt 4 pt 4pt 4 pt 4pt 5pt 5 pt 5 pt 5 pt 5 pt
Extreme numbers compared to the rest of the data.
Add all numbers and divide by the total number of items.
Put numbers in order from least to greatest and take the number in the middle.
1.5 x interquartile range. Subtract from Q1 and add to Q3.
Formula for finding the total number of possibilities, or the Fundamental Counting Principle.
The number of ways the first event can happen times the number of ways the second event can happen, etc.
If you have 5 shirts, 4 pants, and 2 belts this is the total number of outfits you can make.
8 *7*6*5*4*3*2*1 could be rewritten as...
The number of ways 17 horses could finish 1st, 2nd, and 3rd in the Kentucky Derby.
The probability of an event is defined as...
The total number of favorable outcomes divided by (over) the total number of possible outcomes.
The probability of rolling a 3 OR a 4 on one roll of a die.
When the outcome of one event does not affect the outcome of another event, the events are said to be...
The probability of tossing a coin and getting a tail AND of rolling a die and getting a 2.
If a bag contains 5 red, 3 blue, and 7 yellow marbles, the probability of of randomly selecting a 2 red marbles if the first one is NOT replaced is...
The odds in favor of an event occurring is defined as...
The ratio of the number of favorable outcomes to the number of unfavorable outcomes.
The odds of flipping a coin and getting a head is...
The odds against an event occurring is defined as...
The ratio of the number of unfavorable outcomes to the number of favorable outcomes.
The odds AGAINST rolling a die and getting a 5 is...
The odds AGAINST rolling two dice and getting a sum of 7 is...