The Schematic Processor
The Schematic Processor. Presented by Dr. Tim Whiteaker The University of Texas at Austin 18 October, 2011. Outline. Background – Arc Hydro Schematic Processor Use Case – Bacterial loading. Linking GIS and Water Resources. Water Resources. GIS. Arc Hydro: GIS for Water Resources.

The Schematic Processor
E N D
Presentation Transcript
The Schematic Processor Presented by Dr. Tim Whiteaker The University of Texas at Austin 18 October, 2011
Outline • Background – Arc Hydro • Schematic Processor • Use Case – Bacterial loading
Linking GIS and Water Resources Water Resources GIS
Arc Hydro: GIS for Water Resources Published in 2002, now in revision for Arc Hydro II • Arc Hydro • An ArcGIS data model for water resources • Arc Hydro toolset for implementation • Framework for linking hydrologic simulation models The Arc Hydro data model and application tools are in the public domain
What is a hydrologic data model Booch et al. defined a model: “a simplification of reality created to better understand the system being created” Objects Aquifer Stream Well Catchment R.M. Hirsch, USGS
Arc Hydro—Hydrography The blue lines on maps
Arc Hydro—Hydrology The movement of water through the hydrologic system
Flow Time Time Series What’s in Arc Hydro Network Drainage Hydro Features Hydrography Channel
What makes Arc Hydro different? ArcGIS: All features have a unique ObjectID within a feature class. Arc Hydro: All features have a unique HydroID within a geodatabase. HydroID to ID relationships link features and help to trace water movement.
HydroID Relationships Watershed HydroID - 23 JunctionID - 7 HydroJunction HydroID - 7 NextDownID - 8 HydroJunction HydroID - 8
What makes Arc Hydro different? Arc Hydro connects space and time: hydro features are linked to time series. TimeSeries Value - 35 cfs Time - May 7, 2011 FeatureID - 23 Flow HydroID Time Time Series Hydro Features
Arc Hydro Tools Dozens of tools for hydrologic data development and analysis …including schematic network creation
Schematic networks represent connectivity 1) watersheds and streams 2) stream nodes 3) stream links 4) watershed centroids 5) watershed to stream 6) wetland
We can move things through the network… Node Bacterial Input Link Bacterial Input Direction of Flow Decay …simulating processes along the way
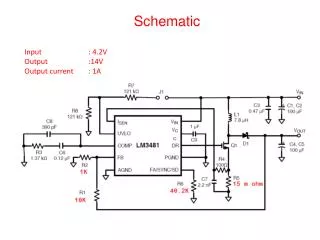
We process values with receiving and passing behaviors Incremental value, i Link or Node Received value(s), r Passed value, p Receiving behavior Passing behavior Total value, t t = f(r,i) p = g(t)
You can create your own behaviors using Python First-order decay Build a library of ops
Bacterial loading in Copano Bay Total Maximum Daily Load Use Case (Slides courtesy of Dr. Stephanie Johnson)
Motivating Factors As of August 2009: Tidal Rivers: 20 impaired 12 impaired for bacteria (Task Force, 2007) Tier 2 Part 3: “… develop simple load duration curve, GIS [geographic information systems], and/or mass balance models.” Statewide: 399 impaired 310 impaired for bacteria Bays: 28 impaired 21 impaired for bacteria
What is a “Load”? Load (#/year) Amount (volume/year) Concentration (#/volume) Concentration of bacteria: CFU/100 m3 Amount of water: m3/day Bacterial load: CFU/year
Non-Point Sources Overland “Net” decay = f (regrowth, resuspension, death) First Order Decay: QC = QCo*e-kτ L = Lo*e-k τ C = concentration (CFU/100mL) Q = flow (m3/yr) L = load (CFU/yr) Lo = initial load (CFU/yr) k = net decay rate (yrs-1) τ = residence time (yrs) decay Non-Tidal Rivers
Loading from Landscape By land use category: Load (CFU/yr) Runoff (m3/yr) Concentration (CFU/m3) • Data sources: • Land use/Land cover: NLCD 1992, NHDPlus ‘catchmentattributesnlcd’ table • Unit runoff by LULC: Quenzer, 1997 • Bacteria concentrations by LULC: Zoun, 2003 * Loading from other land uses accounted for with animal specific loadings.
Loading from Animals (Ag & Wildlife) • Data sources: • Land use/Land cover: NLCD 1992, NHDPlus ‘catchmentattributesnlcd’ table • # animals: Moench & Wagner, 2009 • Loading per animal: Moench & Wagner, 2009 By land use category1: Load (CFU/yr) # animals Load/animal (CFU/yr) 1 Animals were distributed across the watershed by land use.
Septic Systems in Upper Watershed • Data sources: • Land use/Land cover: NLCD 1992, NHDPlus ‘catchmentattributesnlcd’ table • # septics: 1990 Census, TCEQ OARS, county data • Loading per septic: Protocol for Developing Bacteria TMDLs (EPA, 2005) • % septics failing: estimated from literature values & local info (see App. C of dissertation)* • % of load from failing system that reaches the bay: estimated from literature values (see App. C of dissertation)* % of load from failed septic that reaches the stream # septics Load/septic (CFU/yr) % of systems that fail each yr Load (CFU/yr)
Total Nonpoint Source Load per Catchment Total nonpoint source load: li = 2.6 x 10¹⁵ CFU/yr 20*CFU/yr/horse 643*CFU/yr/deer 8*CFU/yr/sheep + LULC 630*CFU/yr/cow 30*CFU/yr/goat 0*CFU/yr/failure 300*CFU/yr/hog 5*CFU/yr/hog
“Net” Decay Bacteria Load In In-Segment Processes Bacteria Load Out move right through ….. Q0, C0 Q, C settle, death resuspension Death, regrowth Non-Tidal River In-segment processes as a “black box” approach, where “net” decay = f(settling, death, regrowth, resuspension, etc.) = k QC = QCo*e-kτ Reminder: L (CFU/yr) = Q (m3/yr) *C (CFU/m3)
Point Sources • Wastewater treatment plants • Failing septic systems around the bay • Bird colonies decay decay
Apply Equations Using Schematic Processor Decay Nonpoint Sources WWTP Bird colony
Calibrate Based on Monitoring Data When: 12952 12944 12943 12948
Evaluate Strategies To Reduce Load • Eliminate nearby septic systems • Implement best management practices to reduce non-point loads from watersheds Published in: http://repositories.lib.utexas.edu/handle/2152/10654
Free Download http://tools.crwr.utexas.edu/