
Uploaded by
anoki
1 SLIDES
195 VIEWS
10LIKES
CTL
DESCRIPTION
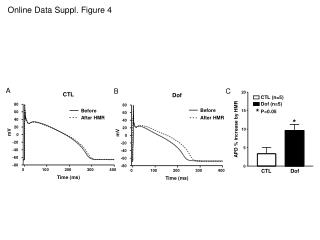
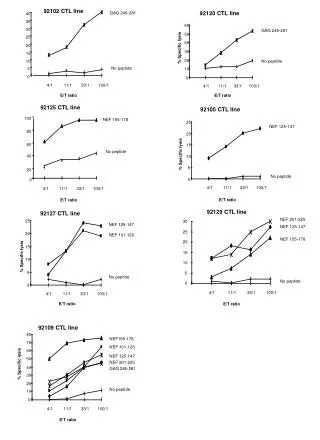
Online Data Suppl. Figure 4. A. B. C. 20. CTL. Dof. CTL (n=5). Dof (n=5). 80. 80. *. Before. Before. 15. P<0.05. 60. 60. After HMR. After HMR. 40. *. 40. 20. 20. APD % increase by HMR. 10. mV. mV. 0. 0. -20. -20. 5. -40. -40. -60. -60. -80. -80. 0. 0. 100.
Download
1 / 1
Download Presentation 
CTL
An Image/Link below is provided (as is) to download presentation
Download Policy: Content on the Website is provided to you AS IS for your information and personal use and may not be sold / licensed / shared on other websites without getting consent from its author.
Content is provided to you AS IS for your information and personal use only.
Download presentation by click this link.
While downloading, if for some reason you are not able to download a presentation, the publisher may have deleted the file from their server.
During download, if you can't get a presentation, the file might be deleted by the publisher.
E N D
Presentation Transcript
Online Data Suppl. Figure 4 A B C 20 CTL Dof CTL (n=5) Dof (n=5) 80 80 * Before Before 15 P<0.05 60 60 After HMR After HMR 40 * 40 20 20 APD % increase by HMR 10 mV mV 0 0 -20 -20 5 -40 -40 -60 -60 -80 -80 0 0 100 200 300 400 CTL Dof 0 100 200 300 400 Time (ms) Time (ms)


More Related