Download
1 / 53
530 likes | 667 Views
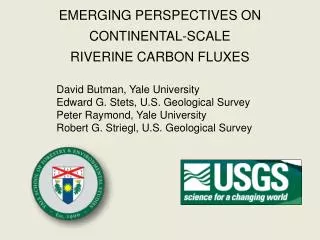
EMERGING PERSPECTIVES ON CONTINENTAL-SCALE RIVERINE CARBON FLUXES David Butman, Yale University Edward G. Stets, U.S. Geological Survey Peter Raymond, Yale University Robert G. Striegl, U.S. Geological Survey. Acknowledgements - NASA Earth and Space Science Fellowship

E N D
EMERGING PERSPECTIVES ON CONTINENTAL-SCALE RIVERINE CARBON FLUXES David Butman, Yale University Edward G. Stets, U.S. Geological Survey Peter Raymond, Yale University Robert G. Striegl, U.S. Geological Survey
Acknowledgements - • NASA Earth and Space Science Fellowship • NSF-Ecosystems CAREER • Yale Center for Earth Observation • Christopher Zappa, Tom Bott, Jody Potter, Patrick Mulholland and William McDowell (Gas Transfer Meta-Analysis), Charlie Crawford, Kathleen Johnson, Cory McDonald.
AQUATIC CARBON CYCLING CO2 IC OC CO2 IC OC Stream flow Downstream or Coastal Upstream Terrestrial Hyporheic IC – Inorganic carbon OC – Organic carbon
AQUATIC CARBON CYCLING CO2 CO2 CO2 IC OC CO2 IC OC CO2 CO2 IC OC Stream flow Sedimentation Downstream or Coastal Upstream Terrestrial Hyporheic IC – Inorganic carbon OC – Organic carbon
AQUATIC CARBON CYCLING CO2 CO2 CO2 IC OC CO2 IC OC CO2 CO2 IC OC Stream flow Sedimentation Downstream or Coastal Upstream Terrestrial Hyporheic IC – Inorganic carbon OC – Organic carbon
AQUATIC CARBON CYCLING “CO2 Flux” “Lateral Flux” CO2 CO2 IC OC CO2 IC OC Stream flow Sedimentation Downstream or Coastal Upstream Terrestrial Hyporheic IC – Inorganic carbon OC – Organic carbon
DATA SOURCES & TERMINOLOGY • Water quality and streamflow data– • USGS National Water Information System (NWIS). • National Stream Quality Accounting Network (NASQAN). • Carbon fractions – • Inorganic carbon (IC) and CO2 • Calculated from Alkalinity, temperature, pH • Assume alkalinity arises from ΣCO2 • Assume particulate fraction of alkalinity is negligible • Organic carbon (OC). • Total organic carbon (TOC) – unfiltered • Dissolved organic carbon (DOC) - filtered
Inorganic carb (g C m-2 yr-1) LATERAL CARBON FLUXES > 4 < otal lux: .7 Tg C yr-1 No CO2 FLUX FROM STREAMS Tota (Tg IC TOC CO2 RIVERINE C FLUX IN PERSPECTIVE
FLUX CALCULATIONS • USGS Load Estimator (LOADEST)- • Calibration data. • Multiple regression. • Calculate daily loads. • Aggregate into annual fluxes.
FLUX CALCULATIONS • USGS Load Estimator (LOADEST)- • Calibration data. • Multiple regression. Seasonal variability Relationship between load and stream flow • Calculate daily loads. • Aggregate into annual fluxes.
FLUX CALCULATIONS • USGS Load Estimator (LOADEST)- • Calibration data. • Multiple regression. • Calculate daily loads. • Aggregate into annual fluxes. Daily TOC loads (x106 g d-1)
FLUX CALCULATIONS • USGS Load Estimator (LOADEST)- • Calibration data. • Multiple regression. • Calculate daily loads. • Aggregate into annual fluxes. Annual TOC loads (Tg C yr-1)
DATABASE FEATURES Observations per year TOC (n = 5,126; 151 sites) IC (n = 4,552; 161 sites) DOC (n = 3,121; 144 sites)
DATABASE FEATURES Weighted by drainage area TOC IC DOC
DATABASE FEATURES Percent included in lateral flux database
SUMMARY OF FINDINGS Lateral flux Tg C yr-1 Total = 45 Total = 42 Total = 37 11 10 9 28 32 34 Observed Corrected for drainage area Corrected for discharge
COMPARISON WITH OTHER STUDIES † § § TOC Flux from Conterminous U.S. (Tg C yr-1) † - Disaggregated by watershed area. § - Disaggregated by biome type.
Inorganic carbon yield (g C m-2 yr-1) > 7 4 – 7 2 - 4 < 2 No data Dissolved organic carbon yield (g C m-2 yr-1) > 4 2 – 4 0.8 – 2 < 0.8 No data
REGIONAL PATTERNS IC Carbon yield g C m-2 yr-1 TOC
Calculating CO2 flux • Stream surface area • CO2 concentrations • Transfer velocity Flux = stream surface area * ([CO2]water - [CO2]air)* k
Stream area • High Resolution NHDPlus data • Inventory of streams • Stream order • Modeled discharge • Modeled slope • Modeled velocity
Stream area Verification data from USGS streamgaging stations Use modeled discharge to calculate stream width. Sum all stream segments to obtain total stream area. n = 1,026 ln discharge Raymond et al. In Prep.
Stream area Verification data from USGS streamgaging stations Use modeled discharge to calculate stream width. Sum all stream segments to obtain total stream area. n = 1,026 Surface Area of Streams: 40,560 km2 ~1/2 of Lake Superior (US) ~Costa Rica ln discharge Raymond et al. In Prep.
CO2 concentrations • Calculated from alkalinity, temperature, and pH • 4,200 sites • 440,000 observations
CO2 concentrations Northern
Gas transfer velocity Raymond et al. in prep K600 (m d-1) = 2841(SV) + 2.025 S= Slope ; V = Velocity
Gas transfer velocity Very high k in low-order Western streams.
Total CO2 flux from streams Flux = stream surface area * ([CO2]water - [CO2]air)* k Total Flux: 96.7 ± 32 Tg C yr-1
Regional CO2 yield CO2 yield g C m-2 yr-1
LATERAL VERSUS CO2 FLUXES • CO2 flux • Diffuse • Dominated by low-order streams. • Lateral flux • Focused • Top 10 streams carry • 75% of IC flux. • 60% of TOC flux. CO2 CO2 CO2 CO2 CO2 CO2 Lateral flux
LATERAL VERSUS CO2 FLUXES • CO2 and lateral fluxes • Correlated with precipitation and runoff. • Water discharge. • Carbon delivery from terrestrial environment. • In-stream carbon transformations. CO2 r2 = 0.86 TOC r= 0.72 g C m-2 yr-1 Runoff (mm yr-1)
Total carbon flux in rivers Total flux (Tg C yr-1) IC 34 TOC 11 CO2 97 Total 142 142 Tg C yr-1
Total carbon flux in rivers Yield (g C m-2 yr-1) IC 4.0 TOC 1.9 CO2 14.9 Total 20.8 20.8 g C m-2 yr-1
Carbon fluxes in context “CO2 Flux” “Lateral Flux” 97 Tg C yr-1 >142 Tg C yr-1 45 Tg C yr-1 Stream flow Sedimentation ?
Regional CO2 yield • Precipitation controls the regional differences in CO2 flux • Short-term: flushing of soil CO2 • Long-term: geomorphology of the density of stream networks (stream surface area).
LATERAL VERSUS CO2 FLUXES • CO2 flux • Dominated by fluxes in small-order streams. • Strong correlation with precipitation. CO2 CO2 CO2 CO2 CO2 CO2 Lateral flux
The dominant source of pCO2 will depend on scale • Headwater systems will show terrestrial respiration • Large river systems will incorporate internal and external sources. Acidity: Precipitation / Mining Carbonate Weathering Soil Respiration Wetlands / Riparian Vegetation Allochthonous DOM Respiration
Contribution of Soil CO2 to River Efflux • Soil Water pCO2 20,000 – 30,000 ppm • Derived land surface run-off from USGS – Waterwatch – Wolcock et al. – in prep. • Total US discharge 1722 km3 • Amazon discharge ~ 5000 km3
Total carbon flux in rivers Yield (g C m-2 yr-1) IC 3.9 TOC 2.8 CO2 25.5 Total 32.2
Stream Surface Area: F(g C yr-1) = ([CO2]water - [CO2]air)* k * Surface Area 1026 sites Stream w = e(0.42(lnQ)+2.55) Raymond et al. in prep
REGIONAL PATTERNS Carbon yield g C m-2 yr-1
REGIONAL PATTERNS Lateral flux Tg C yr-1 8 7 3 6 3 3 34 28 32 Observed Corrected for drainage area Corrected for discharge
Regional CO2 yield CO2 yield g C m-2 yr-1
DATABASE FEATURES Observations per year
Willamette River (at Salem, OR) Illinois River (at Peoria, IL) (at Valley City, IL) Schuylkill River (at Philadelphia, PA)
Acknowledgements – Whitney Broussard (U of Louisiana, Lafayette) Thor Smith (USGS Vermont / New Hampshire) Valerie Kelly (USGS Oregon) Evan Hornig (USGS Austin, TX) Kate Halm (USGS Colorado)
Sources of data and methods of analysis – • Sources • Water quality - • Clarke (1924) compilation of Dole & Stabler survey (USGS). • U.S. Geological Survey (National Water Information System). • Illinois State Water Survey. • Illinois Environmental Protection Agency. • Philadelphia Water Department. • Stream discharge – • U.S. Geological Survey.
Methodological considerations – • Nitrate analysis • Pre-1970 Colorimetric phenoldisulphonic acid method. • After 1970 Colorimetric cadmium reduction. • Organic nitrogen • “Albuminoid ammonia” method used on most samples before 1940. • Total N = Alb. NH3 + NO3 + NO2 + NH3 • Kjeldahl nitrogen used on all samples since 1975. • Total N = TKN + NO3 + NO2 • Sample handling • “Composite samples” – time-averaged. • Discrete samples – single time point. • Holding time in older samples.