Download
1 / 15
150 likes | 331 Views
Learning from evidence in the context of global climate change. Jenny Dauer and Andy Anderson. S cience literacy involves learning from evidence. Analyzing and interpreting data Constructing explanations Engaging in argument from evidence. In context of climate change?

E N D
Learning from evidence in the context of global climate change Jenny Dauerand Andy Anderson
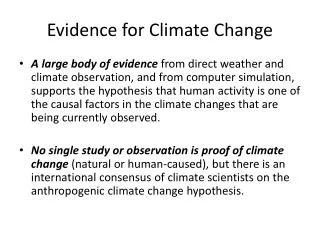
Science literacy involves learning from evidence • Analyzing and interpreting data • Constructing explanations • Engaging in argument from evidence In context of climate change? Evidence is situated in complex interdisciplinary models of earth systems
Iconic representation of evidence for carbon dioxide emissions What does it mean to understand the Keeling Curve?
Qualitative research methods Preliminary interviews and analysis • 28 middle and high school students in science classes in rural Michigan, no common instruction • Keeling Curve was one segment of larger interview on evidence for global climate change • Coding using grounded theory with a team at MSU
Interview Protocol • Q’s to check for reading graphcorrectly. • Do you have any idea why Charles Keeling went there to collect these data? • Do you think we could use these data to estimate CO2 concentrations in Michigan during this period? Why or why not? • Do you see a pattern? If so, what pattern do you see? • What do you think could be the cause of this pattern of the line in blue? … line in red? • Could we use this graph to make predictions about carbon dioxide concentrations at Mauna Loa in 2015? What predictions could you make?
Research Question What are students’ interpretations of the Keeling Curve graph? Two challenges for students: Generalizability of the data to other places on Earth 2) Mechanisms that explain the data A) Overall Upward Trend (blue line) B) Annual Cycle (red line)
1) Student challenges with generalizability Do you think we could use these data to estimate CO2 concentrations in Michigan during this period? Across all 28 interviews: 26% said yes for the overall trend butuncertain about the actual numbers “You could get the same trend in general, but the data points themselves, probably not, because [the two places] have different conditions.” ~Tom, HS Bio
1) Student challenges with generalizability Do you think we could use these data to estimate CO2 concentrations in Michigan during this period? Yes (32%) because: “atmospheres of HI and MI are connected” “HI and MI are alike” Across all 28 interviews: No (39%) because: “atmospheres of HI and MI are not connected” “HI and MI are different”
Scaffolding ideas about generalizability of the Mauna Loa data to other places on Earth - global atmosphere circulation Video of global air circulation http://www.youtube.com/watch?v=qh011eAYjAA
Scaffolding ideas about generalizability of the Mauna Loa data to other places on Earth • how Mauna Loa is removed from local sources of CO2 • how CO2 concentrations have change in other parts of the globe “History of CO2“ or “Pumphandle” Video http://www.esrl.noaa.gov/gmd/ccgg/trends/history.html
2) Student challenges with mechanisms that explain the data What do you think could be the cause of this pattern of the line in blue? 18% clearly articulate that combustion of fossil fuels releases CO2 The remaining students said things like:“Most likely global warming… and ozone depletion” ~Logan, HS Bio“Industries are responsible for pollution” ~Sarah, AP Bio“Volcanoes… plants and animals dying off” ~Pat, HS Bio Across all 28 interviews:
2) Student challenges with mechanisms that explain the data What do you think could be the cause of this pattern of the line in red? 14% say anything about photosynthesis Across all 28 interviews: The remaining students said things like: “Less factories are releasing gases in Oct than April” ~Logan, HS Bio“When it’s colder, gases freeze in the ice” ~Tessa, MS Bio“More people drive in the summer” ~Peter, HS Bio
2) Student challenges with mechanisms that explain the data Vague association with global warming without understanding the mechanism: • confusion about global warming & ozone • many talk about “global warming” as a cause of the data, rather than an effect of CO2emissions • vague reading of the graph • notion of association with factories, plants and volcanoes
These challenges lead to problems understanding mitigation Many people indicate that mitigation for climate change should include: • increasing gas mileage • decreasing coal burning • cleaning up toxic wastes • fixing the hole in the ozone layer • decreasing use of nuclear power (Bostrom, 1994; Kempton, et al. 1996; Leiserowitz & Smith, 2010)
Conclusions If we want students to use and learn from evidence: • Analyzing and interpreting data about CO2 emissions • Constructing explanations about the source of increasing CO2 emissions • Engaging in argument from evidence about best ways to mitigate CO2 emissions …we need to build a coherent model and story for students by providing scaffolds for understanding earth systems.