Download
1 / 31
310 likes | 449 Views
This presentation by R. Cary Tuckfield, an ecological statistician, explores the complexities of global climate change through statistical analysis. It emphasizes that climate change is an ongoing phenomenon supported by extensive data but highlights anthropogenic causes as the critical issue. The talk reviews temperature trends, biological consequences such as changes in species behavior, and the historical context of temperature anomalies, providing a statistician's perspective on an urgent global challenge.

E N D
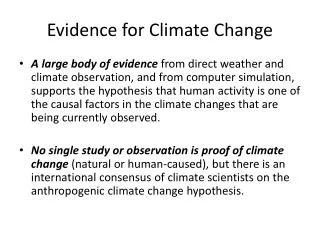
Statistical Evidence in Global Climate Change R. Cary Tuckfield Ecological Statistician April 15, 2011
The Point: • Global Climate Change is not the issue • it is happening, there is data, and it’s complicated • The anthropogenic cause? • that’s the issue
What this talk isn’t… • Comprehensive • Finished • Political • Meteorological (I’m a statistician) • Fanatical, or • “Religical”
What it is… • A review of some of the data • An analysis of temperature trends • One statistician's view (albeit an ecological one) on what to make of it
The Meltdown Disintegration of 1250 mi2 of the Larsen B Antarctic ice shelf in 2002. Dyurgerov and Meier (2005) http://www.globalwarmingart.com/wiki/Image:Glacier_Mass_Balance_png
Receding Glacier: 3 Year Record Columbia Glacier, AK Oct. 5, 2007 – May 7, 2009 www.ExtremeIceSurvey.org
Is this warming trend everywhere? Zonal Mean Temp Anomaly (oC) Latitude from NASA GISS website (land stations only)
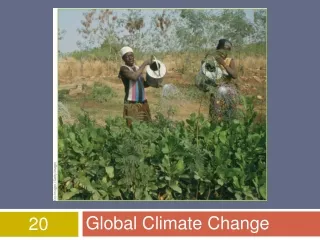
Biological Consequences • Flowering plants are flowering earlier; some not at all • SRS Wood Ducks are nesting earlier in the spring • Wintering ranges for multiple bird species now extend further northward • Butterfly species diversity declining at sea level, increasing at tree line
Earlier Flowering Cardamine hirsuta (42 d) Ave. 1st flowering date 89 species 1970 – 1990 Duchesnea indica (46 d) Lamium purpureum (39 d) DC – Washington CP – College Park, MD Nyssa sylvatica (35 d)
SRS Wood Ducks Wood ducks nesting activity at SRS has advanced by nearly 1 month in a 23 year period, early 70’s – mid 90’s.
Changes in Butterfly Distribution Parnassius clodius • This butterfly, (above) is now found at higher elevations in CA • Overall, diversity is declining at lower elevations and increasing at higher elevations • 35 yrs • 159 species • 10 sites • 0-2,775 ft elev • Sierra Nevada Mtns Forister & Shapiro 2003 Global Change Biol Forister et al. 2010 PNAS
NASA Goddard Institute for Space Studies (GISS) US: Land weather stations only 1880-2007 Global: Land & Ocean weather stations Anomaly: Difference from overall annual average temperature GISS Surface Temperatures Annualized Average Temperature Anomaly (oC) Year
Hadley data set • Met Office Hadley Centre, UK • Global: Land & Ocean weather stations data • 1850-2007 • “smoothed” regression fit to show trends in ecological time Cubic Spline fit Temp Anomaly (oC) Year
World Data station profile Number of Stations (1000s) Record Length (yrs) Years Years • Few stations with many years of data • Today ~2,000 stations per global annual average • > coverage of northern hemisphere
Short-term Trends Global GISS • ~30 year trend periods • Simple Linear Regression (SLR)models / trend period • Differences in Slopes apparent Annualized Average Temperature Anomaly (oC) Global Hadley Year
Temperature Anomaly (oC) Year Year Slopes: Statistical test results • Rates of temperature increase for 1916-1945 and 1978-2007 are indistinguishable • Rates not different between GISS and Hadley datasets • Overall rate = 1.6 oC / century
IPCC “Brouhaha” • 1961 – 1990 baseline • Spline fits • Both graphs presented • But, the “mud” hit the fan over the lower panel Northern Hemisphere Anomaly (oC) Relative to 1961 to 1990 http://climateaudit.org/2009/12/10/ipcc-and-the-trick/ Year
Long-term Historical Trends Medieval Warming Period • Loehle 2007 Energy & Environment • From 18 different non-treering datasets Little Ice Age
Global GISS Temperatures Mauna Loa, HI Weather Station Is CO2 the culprit? Mean Annual CO2 (ppm) Temperature Anomaly (oC) Year
Same scale on X- & Y-axes Monotonic + trend > Variation within & between stations Eco-time trends in CO2 Point Barrow, AK Mauna Loa, HI CO2 Concentration (ppm) South Pole, Anarctica http://cdiac.ornl.gov/trends/co2/ Year
Polar Perspectives Could annual CO2 cycling have to do with seasonal photosynthetic output?
87Sr/86SR isotopic ratio is highly correlated with inorganic-organic 13C/12C isotope ratio Co-dependent on weathering & magmatic processes Partial pressure in atmospheric CO2 inferred from ratio fluctuations pCO2(t) / pCO2(0) Time (106 yrs BP) Evolutionary time trends in CO2 Rothman 2002 PNAS Conclusion: Atmospheric CO2 un-related to climatic conditions
Findings • Global surface temps show • Variable short-term trends – + rates & - rates • Millennial & evolutionary cycles in warming/cooling • CO2 is monotonically increasing over relatively short time periods, but temp doesn’t • CO2 concentration shows constant annual & Cenozoic cycling • CO2 cycles have higher amplitude in northern hemisphere
So, In Summary • Climate change is always occurring • Global surface temperature is recently (<50 yrs) and positively correlated with atmospheric CO2 • Historically, temperatures were as high or higher than now • Pre-historically, CO2 and temperature seem more correlated to geochemical processes
What to do? • Is it wise to act without certain knowledge? • How do we know whether IPCC’s recommendations will work? • What are the consequences if we do nothing? • Or, something that doesn’t work?
No Easy Answers • Not all scientists are in agreement • Some data support the anthropogenic hypothesis, some don’t • Some things just can’t be measured well, or at all • Consequently, Global Warming has become a political issue • It is a matter of interpretation and belief (given the data and funding, respectively)
Take Home Message • Personal decision is the right of citizenship – data are usually helpful • Find out what the data are “saying” • But convincingevidenceis a matter of judgment and opinion Remember, in a democratic republic, citizen opinion (i.e. the vote) “trumps” science, whether they are in agreement or not. In the rest of the world, well,…that’s another matter.